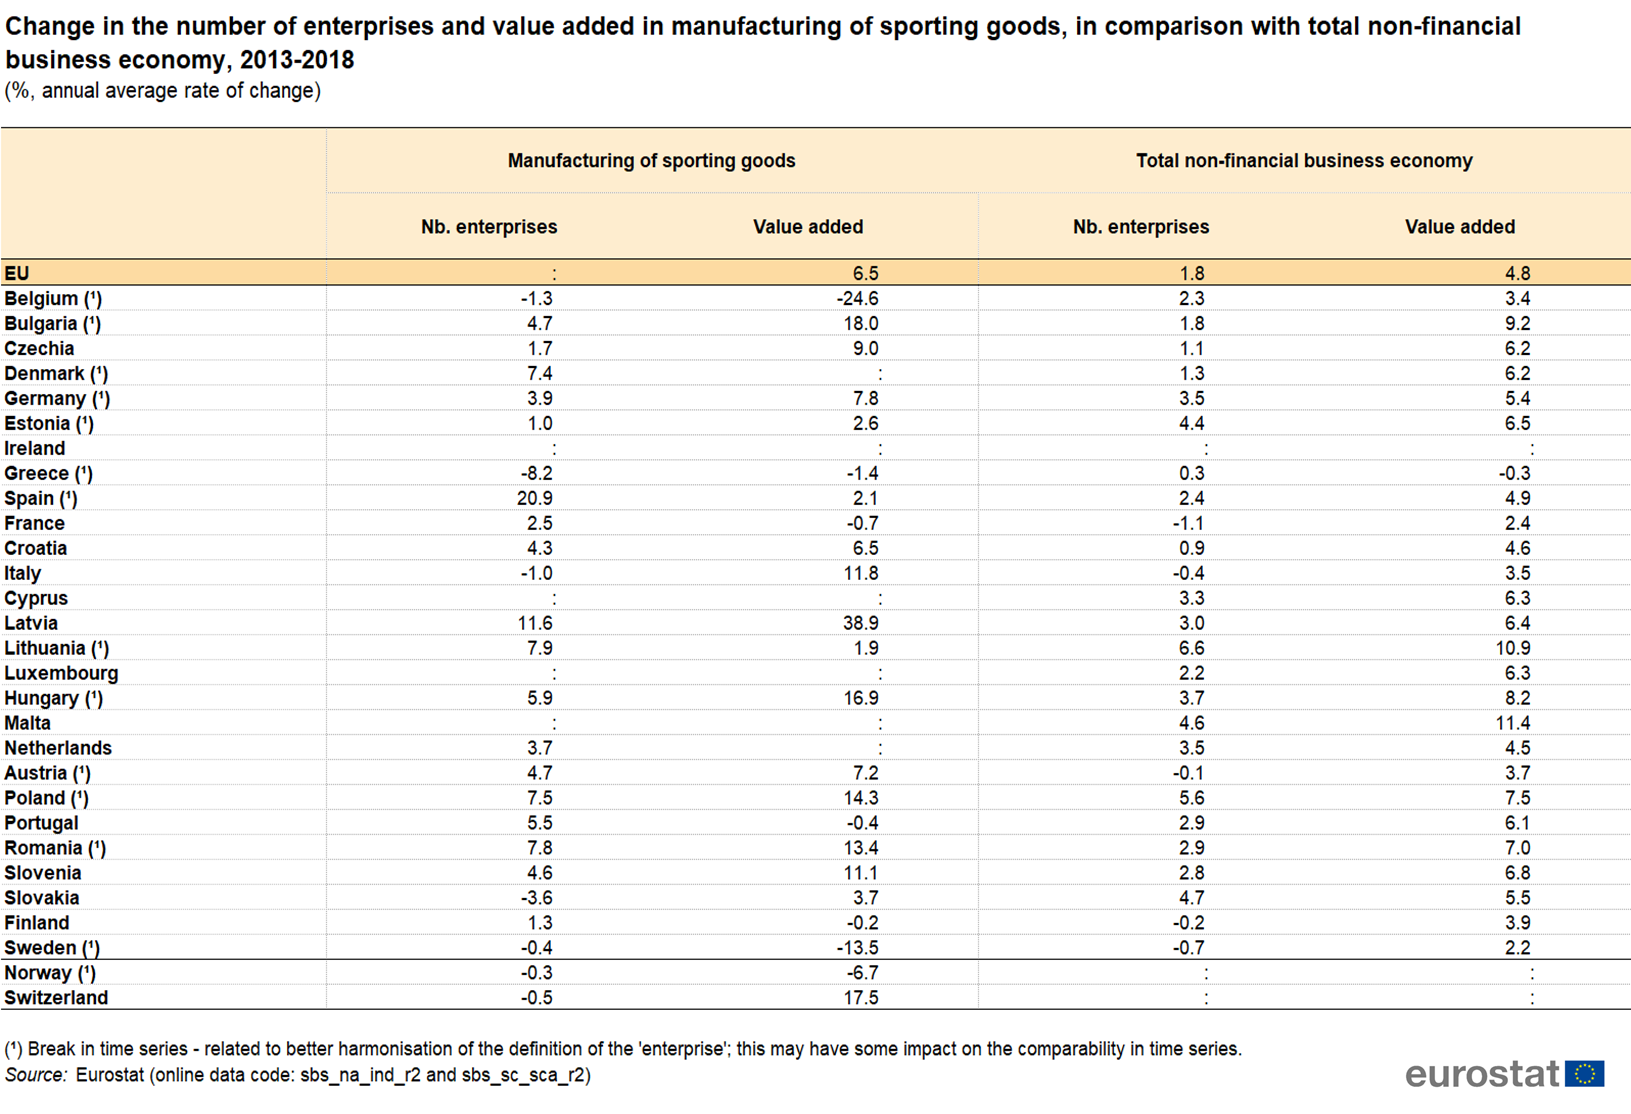
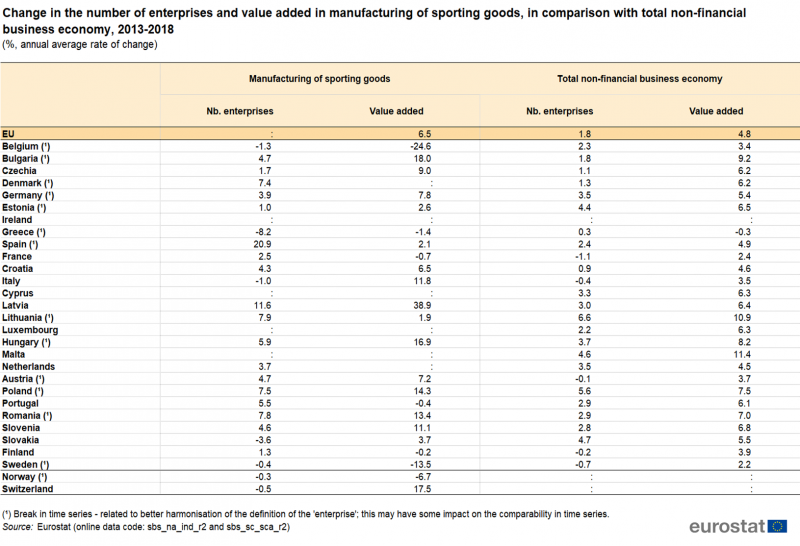
File:Table 2 - Change in the number of enterprises and value added in manufacturing of sporting goods, in comparison with total non-financial business economy, 2013-2018.png
Size of this preview: 800 × 546 pixels. Other resolutions: 320 × 219 pixels | 1,631 × 1,114 pixels.
Original file (1,631 × 1,114 pixels, file size: 457 KB, MIME type: image/png)
File usage
There are no pages that use this file.