Archive:SDG 3 - Good health and well-being (statistical annex)
Ensure healthy lives and promote well-being for all at all ages (statistical annex)
Data extracted in May 2020.
Planned article update: June 2021.
Highlights

This article provides an overview of statistical data on SDG 3 ‘Good health and well-being’ in the European Union (EU). It is based on the set of EU SDG indicators for monitoring of progress towards the UN Sustainable Development Goals (SDGs) in an EU context.
This article is part of a set of statistical articles, which are based on the Eurostat publication ’Sustainable development in the European Union — Monitoring report - 2020 edition’. This report is the fourth edition of Eurostat’s series of monitoring reports on sustainable development, which provide a quantitative assessment of progress of the EU towards the SDGs in an EU context.
Full article
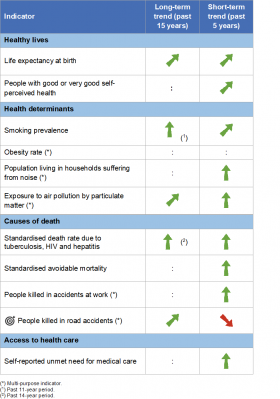
Table 1: Indicators measuring progress towards SDG 3, EU-27

Table 2: Explanation of symbols for indicating progress towards SD objectives and targets


Life expectancy at birth

Life expectancy at birth is defined as the mean number of years that a new-born child can expect to live if subjected throughout his or her life to the current mortality conditions (age-specific probabilities of dying). It is a conventional measure of a population’s general health and overall mortality level.
.png)
_of_the_life_expectancy_at_birth,_EU,_2020.png)
Source: Eurostat (sdg_03_10)
_2020.png)
People with good or very good self-perceived health

The indicator is a subjective measure on how people judge their health in general on a scale from ‘very good’ to ‘very bad’. The data stem from the EU Statistics on Income and Living Conditions (EU-SILC). Indicators of perceived general health have been found to be a good predictor of people’s future healthcare use and mortality.
.png)
Source: Eurostat (sdg_03_20)
_of_the_share_of_people_with_good_or_very_good_perceived_health,_EU,_2020.png)
Source: Eurostat (sdg_03_20)
.png)
Source: Eurostat (sdg_03_20)
Smoking prevalence

This indicator measures the percentage of the population aged 15 years and over who report that they currently smoke boxed cigarettes, cigars, cigarillos or a pipe [1]. It does not include the use of other tobacco and related products such as electronic cigarettes and snuff. The data are collected through a Eurobarometer survey and are based on self-reported use during face-to-face interviews in people’s homes.
.png)
Source: European Commission services, Eurostat (sdg_03_30)
_of_the_smoking_prevalence,_EU,_2020.png)
Source: European Commission services, Eurostat (sdg_03_30)
.png)
Source: European Commission services, Eurostat (sdg_03_30)
Standardised death rate due to tuberculosis, HIV and hepatitis

The indicator measures the age-standardised death rate of selected communicable diseases. The rate is calculated by dividing the number of people dying due to tuberculosis, HIV and hepatitis by the total population. This value is then weighted with the European Standard Population [2].
.png)
Source: Eurostat (sdg_03_41)
_of_the_standardised_death_rate_due_to_tuberculosis,_HIV_and_hepatitis_EU,_2020.png)
Source: Eurostat (sdg_03_41)
.png)
Source: Eurostat (sdg_03_41)
Standardised avoidable mortality

Avoidable mortality covers both preventable and treatable causes of mortality. Preventable mortality refers to mortality that can mainly be avoided through effective public health and primary prevention interventions (i.e. before the onset of diseases/injuries, to reduce incidence). Treatable mortality can mainly be avoided through timely and effective health care interventions, including secondary prevention and treatment (after the onset of diseases to reduce case-fatality). The total avoidable mortality rate includes a number of infectious diseases, several types of cancers, endocrine and metabolic diseases, as well as some diseases of the nervous, circulatory, respiratory, digestive, genitourinary systems, some diseases related to pregnancy, childbirth and the perinatal period, a number of congenital malformations, adverse effects of medical and surgical care, a list of injuries and alcohol and drug related disorders.
.png)
Source: Eurostat (sdg_03_42)
_of_the_standardised_avoidable_mortality_EU,_2020.png)
Source: Eurostat (sdg_03_42)
.png)
Source: Eurostat (sdg_03_42)
Self-reported unmet need for medical care

The indicator measures the share of the population aged 16 and over reporting unmet needs for medical care due to one of the following reasons: ‘financial reasons’, ‘waiting list’ and ‘too far to travel’. Self-reported unmet needs concern a person’s own assessment of whether he or she needed medical examination or treatment (dental care excluded), but did not have it or did not seek it. The data stem from the EU Statistics on Income and Living Conditions (EU-SILC). Since social norms and expectations may affect responses to questions about unmet care needs, caution is required when comparing differences in the reporting of unmet medical examination across countries. In addition, the different organisation of healthcare services is another factor to consider when analysing the data. Finally, there are also some variations in the survey question across countries and across time [3].
.png)
Source: Eurostat (sdg_03_60)
_of_the_self-reported_unmet_need_for_medical_care,_EU,_2020.png)
Source: Eurostat (sdg_03_60)
.png)
Source: Eurostat (sdg_03_60)
Direct access to
More detailed information on EU SDG indicators for monitoring of progress towards the UN Sustainable Development Goals (SDGs), such as indicator relevance, definitions, methodological notes, background and potential linkages, can be found in the introduction of the publication ’Sustainable development in the European Union — Monitoring report - 2020 edition’.
Notes
- ↑ European Commission (2017), Attitudes of Europeans towards tobacco and electronic cigarettes, Special Eurobarometer 458, Annex.
- ↑ Standardised death rates take into account the fact that countries with larger shares of older inhabitants also have higher death rates. See also: Eurostat (2013), Revision of the European Standard Population, Report for Eurostat’s Task Force, Publications Office of the European Union, Luxembourg.
- ↑ OECD/EU (2018), Health at a Glance: Europe 2018 — State of Health in the EU Cycle, OECD Publishing, Paris, p. 170.