Archive:Trade in business services
Data extracted in February 2021
Planned article update: February 2022
Highlights
In 2018, almost half of EU sales by the software publishing sector were generated from clients residing in other countries.
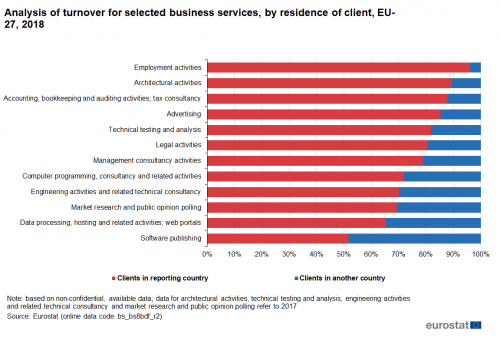
In 2018, the EU employment activities sector recorded the highest levels of sales generated from clients residing in the reporting countries - 96.1%.
[[Image:[[Image:|thumb|right|350px]].png |thumb|centre|500px|Analysis of turnover for selected business services, by residence of client, EU-27, 2018
(% of turnover)
Source: Eurostat
(bs_bs8bdf_r2)]]
Globalisation patterns in EU trade and investment is an online Eurostat publication presenting a summary of recent European Union (EU) statistics on economic aspects of globalisation, focusing on patterns of EU trade and investment.
The business services sector can be viewed as providing key inputs in the production of other goods and services. As such, it makes an important contribution to EU-27 economy, promoting competitiveness and growth. The business services sector has expanded in recent years: this growth has been underpinned by the development of new services and more specialised tasks (including the management of supply chains and international production networks), but also reflects increased levels of outsourcing to external suppliers. These changes have provided a stimulus for the business services sector to become increasingly global in nature. Furthermore, technological changes have allowed smaller businesses to enter niche markets where previously they may have lacked the scale to trade internationally.
This article provides an analysis of the turnover (sales) of EU enterprises in the business services sector, according to the residence of their clients — information is presented for residents in the reporting country and for non-residents customers from another EU Member States. The analysis is based on non-confidential data, disseminated in the Eurostat database.
Full article
Analysis of turnover for selected business services
In 2018, more than half of EU sales by the software publishing sector were generated from clients residing abroad
Figure 1 shows the proportion of business services turnover in 2018 by recidence of the client. For each of the business services shown, a majority of the EUs turnover was realised by sales to clients from the reporting country (in other words, from clients residing in the domestic economy). This pattern was particularly evident for Employment services; Architectural activities; Accounting, bookkeeping and auditing activities; tax consultancy; Advertising; Technical testing and analysis and Legal activities, where more than 80% of the sales were to customers in the reporting economy. Whereas clients resident in other countries accounted for a higher share of total sales for activities such as software publishing services (48.3%) and Data processing, hosting and related activities; web portals (34.7%). Such disparities may be linked to the tradability of various services, the different modes for trading services, or barriers to entry which prevent/restrict trade in some business services.
<newarticle>In 2018, 96.1 % of the sales made by EU-27 employment activities were to clients from the reporting country; by contrast, the percentage of total turnover accounted for by domestic clients fell to 51.7 % for software publishing activities. Among the activities recorded, the share of turnover that was attributed from other EU member states was generally higher than that from clients residing in non-member states. For example, almost half of the total turnover generated in software publishing (48.3 %) and one third in data processing (34.7 %) was accounted for by clients residing in other EU Member States.

(% of turnover)
Source: Eurostat (bs_bs8bdf_r2)
Ranking of the turnover generated by selected business services
In 2018, the EU software publishing services sector recorded the highest levels of sales generated from clients residing in other EU countries.
Looking in more detail at developments across the individual EU Member States, Table 1 shows a ranking of the turnover generated by selected business services, according to the residence of clients. In 2018, German computer programming and consultancy enterprises recorded the highest value of business services sales to clients residing in another EU Member State (EUR 32.0 billion). The same activity — computer programming and consultancy — also accounted for the second, third and fourth highest value of sales, as made by Swedish, Dutch and Spanish enterprises.
Aside from these, the other top rankings included engineering activities from German, Spanish and French enterprises whose turnover was ranked fifth, seventh and eight, respectively. Regarding the value of turnover, those two sectors (computer programming and engineering) are can be considered dominant in 2018.
While the rankings of overall turnover are unsurprisingly dominated by some of the largest EU Member States, the second half of the table, presenting the percentage of the national sector's turnover that was generated by clients from abroad, is not. In 2018, 100% of the Cypriot sales made in the Engineering activities and related technical consultancy and 95% of the sales in the Computer programming, consultancy and related activities were derived from clients residing in other EU Member States.
The next highest shares were recorded for software publishing services in Finland (89.0 %) and in Czechia (85.1 %). The next highest shares were recorded for data processing in Latvia (84.5 % of their turnover was generated from clients resident in a non- EU country) and market research and public opinion polling services in Slovenia (82.1 %).
Source: Eurostat (bs_bs8bdf_r2)
Source data for tables and graphs
Direct access to
- Business services statistics (ESMS metadata file — bs_esms)