Archive:Impact of the economic crisis on unemployment
- Data from July 2009, most recent data: Further Eurostat information, main tables and database.
Unemployment has been rising sharply in the European Union since March 2008 as a result of the global economic crisis. The increase is felt in every Member State, although the severity varies widely between countries and groups. Men are clearly affected more than women. Young people also appear to be more vulnerable.
The statistics presented are primarily based on results (first quarter of 2009) from the European labour force survey (LFS). Monthly unemployment figures come from Eurostat using auxiliary monthly information combined with the LFS. All figures are seasonally adjusted and made comparable between countries.
Main statistical findings
- Sharp increase in unemployment in the EU.
- Impact of economic crisis varies by Member State, gender and age.
The evolution of unemployment during the current crisis
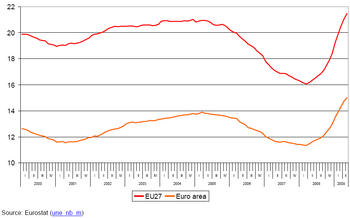
After three years of steadily declining unemployment, Europe is seeing the impact of the econonomic crisis on its labour market. In both the euro area (EA-16) and the EU, the number of unemployed has increased every month since its low in March 2008. Since then, the number of unemployed people in the euro area went up by 3.7 million to a total of 15.0 million in May 2009. In the same period, EU unemployment rose by 5.4 million to reach 21.5 million.
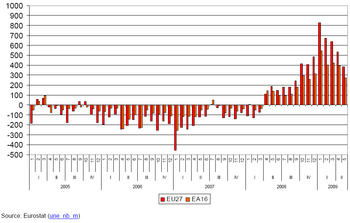
The monthly increase in the euro area has gone up from around 100 000 in mid-2008 to a recent peak of half a million in January 2009. However, in the last few months, the pace of the increase has slowed down. In the EU, the maximum increase was also recorded in January 2009, at around 800 000, in a single month before going down in recent months.
The unemployment rate, which measures the proportion of persons unemployed to the total labour force, rose from 7.2 % in March 2008 to 9.5 % in May 2009 in the euro area. In the same period, the rate in the EU surged from 6.7 % to 8.9 %. The unemployment rate in May 2009 is the highest since May 1999 for the euro area, while for the EU it is the highest since June 2005.
Timing varies across Member States
Member States faced the onset of rising unemployment at very different points in time.
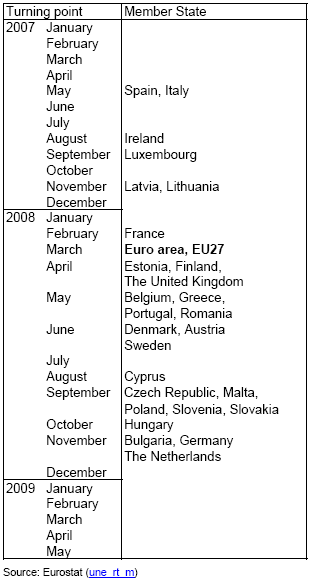
While unemployment in the EU as a whole clearly began rising in March 2008, individual Member States have been affected differently by the crisis. One explanation for this is that Member States structure and regulate their labour markets very differently from one another. All Member States are seeing rising unemployment, but the onset of the increase varies considerably from country to country as shown in table 1.
In Spain and Italy, unemployment started to rise as early as May 2007. Ireland, Luxembourg, Latvia and Lithuania followed in 2007. In France, the rate has increased since February 2008. All other Member States have a turning point later than the euro area and the EU. One can make a distinction between two groups. The first one - Estonia, Finland, the United Kingdom, Belgium, Greece, Portugal, Romania, Denmark, Austria and Sweden - started experiencing rising unemployment in the second quarter of 2008. The remaining countries saw unemployment increasing only in the second half of 2008. In Bulgaria, Germany and the Netherlands,ising unemployment rates were recorded starting in November 2008, one and a half years later than in Spain and Italy.
It should be mentioned that for some countries the turning point is much more distinctive than for others, though there are no clear geographical patterns.
Unemployment by country
Baltic Member States and Spain hardest hit.
The Baltic Member States and Spain have seen much more severe unemployment rate increases, which has held steady at around 0.1-0.2 percentage points a month in most other Member States.
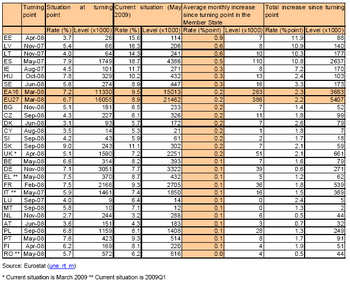
In Estonia, the unemployment rate has risen by almost a full percentage point a month since its lowest point in April 2008. In little over a year, the ranks of the unemployed have swelled from 26 000 to 114 000, from 3.7 % to 15.6 %. Latvia and Lithuania have experienced an average increase of 0.6 percentage points a month since their common turning point in November 2007. Both saw their unemployment rate more than triple in this period, as shown in Table 2.
The Spanish labour market has also been hit hard by the current economic crisis. An early onset of rising unemployment in May 2007, in combination with rapid monthly expansion, has led to an additional 2.6 million unemployed. In May 2009, two years after unemployment started to rise, Spain has the EU's highest jobless rate at 18.7 %. As one of the larger Member States, Spain has a strong influence on the European figures. Nearly one-third (29 %) of all unemployed people in the euro area live in Spain (which accounts for 20 % of the EU total).
Despite its early turning point in May 2007, unemployment in Italy has increased relatively little. The rate rose by 1.5 percentage points between the second quarter of 2007 and the first quarter of 2009. Germany, the Netherlands, Austria and Romania have seen increases of less than one percentage point since their respective lowest points.
Gender differences
Men affected more than women, rates converged in the EU.
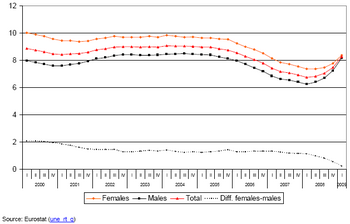
In the labour market, the current crisis has affected men more than women. The construction, financial services and automotive sectors, all of which traditionally employ more men, have been hit especially hard. Between late 2002 and early 2007, the unemployment gender gap was stable at around 1.3 percentage points, with a higher rate for women. But in the last two years, most markedly since the first quarter of 2008, the rates have converged. In the first quarter of 2009, the male unemployment rate has moved to only 0.3 percentage points below the female rate.
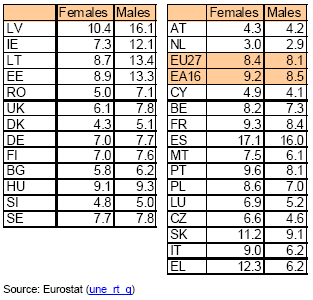
In 14 Member States, the female unemployment rate is higher, most noticeably in Greece, Italy, Slovakia and the Czech Republic. By contrast, in Latvia, Ireland, Lithuania, Estonia and Romania, the male unemployment rate is higher by more than 2 percentage points. Between the first quarters of 2008 and 2009, the male unemployment rate increased more than the female rate in all Member States except Malta, Poland and Romania.
Youth unemployment
Rate up sharply to over 18 %.
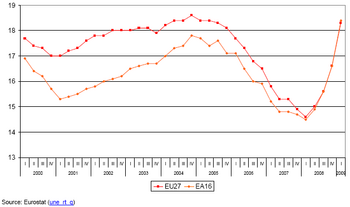
Youth unemployment has been increasing in the euro area and the EU since the first quarter of 2008, albeit at a faster pace than the overall unemployment rate.
Youth unemployment increased by 3.9 percentage points between the first quarter of 2008 and the first quarter of 2009 in the euro area to reach 18.4 %. In the EU, the increase was 3.7 percentage points, leading to a rate of 18.3 % in the first quarter of 2009. In the same period, the total rate increased by 1.6 percentage points in the euro area and 1.5 percentage points in the EU.
In the first quarter of 2009, 4.9 millions people aged 15-24 were unemployed, of which 3.1 million were living in the euro area. This is an increase of around 900 000 in the EU and 600 000 in the euro area since the first quarter of 2008.
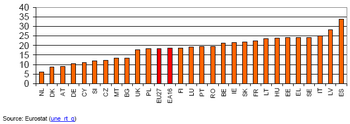
The youth unemployment rate ranges from 6.0 % in the Netherlands to 33.6 % in Spain in the first quarter of 2009. Youth unemployment rates are significantly higher than the total unemployment rate in each country. However, one should keep in mind that a large proportion of people between 15 and 24 are outside the labour market. Unemployment rates are expressed as a percentage of the labour force (employed plus unemployed), not of the population.
Data sources and availability
The main source used by Eurostat for the unemployment figures is the European Labour force survey (LFS). This household survey is carried out in all Member States of the European Union in accordance with European legislation. It provides figures at least each quarter.
There is currently no legal basis for producing and disseminating monthly unemployment data. For many countries, Eurostat calculates monthly data by using additional monthly figures from unemployment registers. The quarterly LFS results are always used as a benchmark to ensure international comparability. Few countries actually supply monthly unemployment figures directly from the LFS.
Interesting groups not covered in this article
Eurostat has detailed quarterly information on unemployment for groups not covered in this article, such as the elderly, long-term unemployed and jobless households. This information is easily accessible on the Eurostat database using the links below.
Turning point – definition used
In this article, the turning point is defined as the month with the lowest unemployment rate in recent years. Where the same lowest rate (rounded to 1 decimal place) is observed in more than one month, the latest month is used as a reference. It does not necessarily mean that the unemployment rate has risen each month since then, but rather that the rates did not decline further.
Context
The unemployment rate is an important indicator with both social and economic dimensions. From an economic perspective, unemployment indicates unused available labour. Rising unemployment may also result in loss of income for individuals and increased pressure on government spending on social benefits.
The unemployment rate according to the International Labour Organization definition is the most widely used labour market indicator because of its international comparability and relatively timely availability. Besides the unemployment rate, indicators such as employment and job vacancies also give useful insight into labour market developments.
The time series on unemployment are used by the EU and other public institutions and the media as an economic indicator. Banks use the data for business cycle analysis. Finally, the general public is generally interested in changes in unemployment.
The unemployment rate is considered a ‘lagging indicator’. When there is an economic downturn, it usually takes several months before the unemployment rate begins to rise. Once the economy starts picking up again, employers are usually still cautious and it takes several more months for the unemployment rate to start falling.
Further Eurostat information
Publications
- Sharp increase in unemployment in the EU – Statistics in focus 53/2009
- Unemployment news release September 2009
Main tables
- LFS main indicators (t_lfsi)
- Unemployment - LFS adjusted series (t_une)
- LFS series - detailed annual survey results (t_lfsa)
- Unemployment rates of the population aged 25-64 by level of education (tps00066)
Database
- LFS main indicators (lfsi)
- Unemployment - LFS adjusted series (une)
- LFS series - detailed quarterly survey results (from 1998)
- Total unemployment - LFS series (lfsq_unemp)
- LFS series - Detailed annual survey results (lfsa)
- Total unemployment - LFS series (lfsa_unemp)
Methodology/Metadata
- Employment and unemployment (Labour force survey) [ESMS metadata file - employ_esms]
- LFS main indicators [ESMS metadata file - lfsi_esms]
- LFS series - Detailed quarterly survey results (from 1998) [ESMS metadata file - lfsq_esms]
- LFS series - Detailed annual survey results[ESMS metadata file - lfsa_esms]
Other information
- Labour force survey (LFS) – Definitions Eurostat website)
- Labour Force Survey in the EU, Candidate and EFTA countries - Main characteristics of the 2006 national surveys (publication)
- Unemployment - LFS-adjusted series (ESMS - Reference Metadata in Euro SDMX Metadata Structure)
External links
- International Labour Organization - ILO Global Job Crisis Observatory
- OECD Statistics Portal - Labour
