Archive:SDG 17 - Partnerships for the goals (statistical annex)
Strengthen the means of implementation and revitalise the global partnership for sustainable development (statistical annex)
Data extracted in May 2020.
Planned article update: June 2021.
Highlights

This article provides an overview of statistical data on SDG 17 ‘Partnership for the goals’ in the European Union (EU). It is based on the set of EU SDG indicators for monitoring of progress towards the UN Sustainable Development Goals (SDGs) in an EU context.
This article is part of a set of statistical articles, which are based on the Eurostat publication ’Sustainable development in the European Union — Monitoring report on progress towards the SDGS in an EU context — 2020 edition’. This report is the fourth edition of Eurostat’s series of monitoring reports on sustainable development, which provide a quantitative assessment of progress of the EU towards the SDGs in an EU context.
Full article
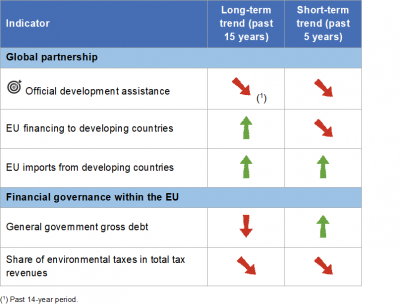
Table 1: Indicators measuring progress towards SDG 17, EU-27

Table 2: Explanation of symbols for indicating progress towards SD objectives and targets


Official development assistance

Official development assistance (ODA) is provided by governments and their executive agencies to support economic development and welfare in developing countries. ODA must be concessional in character, having a grant element that varies in proportion depending on the recipient. Eligible countries are named in the Organisation for Economic Development and Cooperation’s (OECD) Development Assistance Committee (DAC) official list of ODA recipients. ODA disbursements and their purpose are reported by donors to the OECD. Data stem from the OECD (DAC). A new methodology to calculate the ODA value of concessional loans is applied from 2018 onwards and affects comparability of data with previous years [1].
.png)
Source: OECD (sdg_17_10)
_of_the_official_development_assistance_as_share_of_gross_national_income,_EU,_2020.png)
Source: OECD (sdg_17_10)
.png)
Source: OECD (sdg_17_10)
.png)
Source: OECD (sdg_17_10)
EU financing to developing countries

EU financing to developing countries takes a number of forms. These, as documented by the OECD, include: ODA (public grants or concessional loans with the aim of supporting economic development and welfare); other official flows (OOFs) (public flows that are not focused on development or with a grant element of less than 25 %); private flows (direct investment, bonds, export credits and multilateral flows); grants by non-governmental organisations (from funds raised for development assistance and disaster relief), and officially supported export credits. Data stem from the OECD (DAC).
.png)
Source: OECD (sdg_17_20)
_of_the_EU_financing_to_developing_countries,_EU,_2020.png)
Source: OECD (sdg_17_20)
EU imports from developing countries

This indicator is defined as the value (at current prices) of EU imports from the countries on the DAC list of ODA beneficiaries. It indicates to what extent products from these developing countries access the EU market. Information for this indicator is provided by enterprises with a trade volume above a set threshold and is collected on the basis of customs declarations. This information is then adjusted by Member States to account for the impact of trade under this threshold.
.png)
Source: Eurostat (sdg_17_30)
_of_the_EU_imports_from_developing_countries,_EU,_2020.png)
Source: Eurostat (sdg_17_30)

Source: Eurostat (sdg_17_30) and (ext_lt_maineu)
General government gross debt

The Treaty on the Functioning of the European Union defines this indicator as the ratio of government debt at the end of the year to gross domestic product at current market prices. For this calculation, government debt is defined as the total consolidated gross debt at nominal value in the following categories of government liabilities (as defined in ESA 2010): currency and deposits (AF.2), debt securities (AF.3) and loans (AF.4). Central government, state government, local government and social security funds are included.
.png)
_of_the_general_government_gross_debt,_EU,_2020.png)
Source: Eurostat (sdg_17_40)
.png)
Source: Eurostat (sdg_17_40)

Environmental taxes are defined as taxes that are based on a physical unit (or proxy of it) of something that has a proven, specific negative impact on the environment. There are four types of environmental taxes: energy taxes, transport taxes, and pollution and resource taxes.
.png)
Source: Eurostat (sdg_17_50)
_of_the_share_of_environmental_taxes_in_total_tax_revenues,_EU,_2020.png)
Source: Eurostat (sdg_17_50)
.png)
Source: Eurostat (sdg_17_50)
Direct access to
Notes
- ↑ The OECD-DAC has decided on a new methodology to calculate the ODA value of concessional loans. It is applied for the first time to 2018 total ODA data for official loans and loans to multilateral institutions; however, not to data on ODA to specific recipients, regions or groups like Africa or LDCs. In the past (‘flow basis method’), the actual flows of cash between a donor and a recipient country were recorded and a loan was recorded at ‘face value’ as ODA but subsequent repayments by countries were then subtracted as negative ODA. The new method (‘grant equivalent method’) reports the grant equivalent of loans calculated on the basis of the donor effort; correspondingly, reflows are no longer counted. 2018 ODA and ODA/GNI figures (without a specified recipient group) are reported on a grant equivalent basis. ODA and ODA/GNI figures for previous years, as well as 2018 ODA and ODA/GNI figures with a specified recipient group such as LDCs, are reported on a flow basis. Grant equivalent figures are not comparable with previous years’ data calculated on a flow basis. The change of reporting methodology accounts for a 0.01 percentage point decrease in the EU collective ODA/GNI ratio in 2018.
More detailed information on EU SDG indicators for monitoring of progress towards the UN Sustainable Development Goals (SDGs), such as indicator relevance, definitions, methodological notes, background and potential linkages, can be found in the introduction of the publication ’Sustainable development in the European Union — Monitoring report - 2020 edition’.