_RYB19.png)
 RYB19.png&body=Statistics Explained - GDP per inhabitant, pace of economic recovery since 2008 (first year after the crisis when GDP per inhabitant in PPS was above its 2008 level, by NUTS 2 regions) RYB19.png %0A https%3A%2F%2Fec.europa.eu%2Feurostat%2Fstatistics-explained%2Findex.php%3Ftitle%3DFile%3AGDP_per_inhabitant%2C_pace_of_economic_recovery_since_2008_%28first_year_after_the_crisis_when_GDP_per_inhabitant_in_PPS_was_above_its_2008_level%2C_by_NUTS_2_regions%29_RYB19.png)
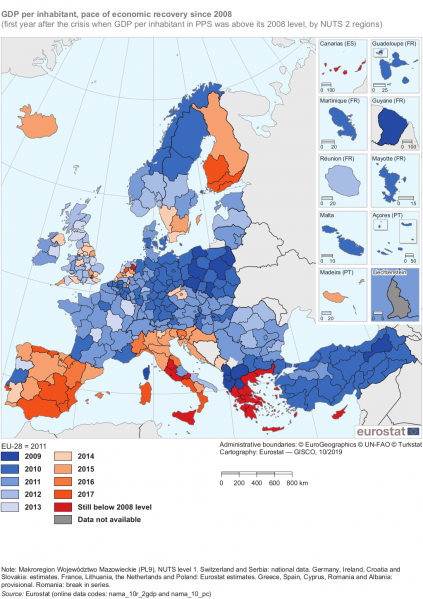
File:GDP per inhabitant, pace of economic recovery since 2008 (first year after the crisis when GDP per inhabitant in PPS was above its 2008 level, by NUTS 2 regions) RYB19.png
Revision as of 15:03, 28 June 2019 by EXT-G-Albertone (talk | contribs)
_RYB19.png)
_RYB19.png&diff=cur&oldid=440168)
_RYB19.png&direction=next&oldid=440168)
_RYB19.png&diff=next&oldid=440168)

Size of this preview: 423 × 599 pixels. Other resolutions: 169 × 240 pixels | 1,023 × 1,448 pixels.
Original file (1,023 × 1,448 pixels, file size: 479 KB, MIME type: image/png)
_RYB19.png&oldid=440168)
_RYB19.png&action=edit&redlink=1)
_RYB19.png&action=history)