Archive:European Neighbourhood Policy - South - living conditions statistics
Data extracted in December 2018.
Planned article update: January 2020.
Highlights
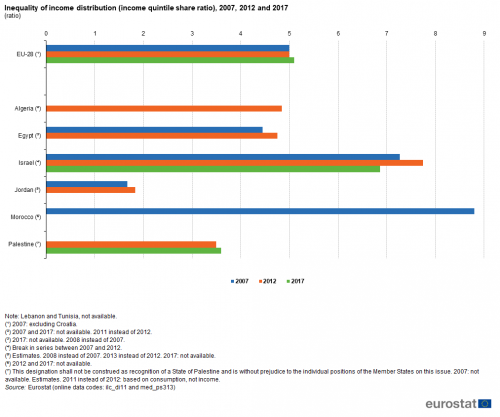
In 2017, Algeria and Egypt reported a similar level of income inequality to the EU, Israel and Morocco reported more pronounced levels, while Palestine and Jordan had lower levels.
In 2016, expenditure on health accounted for more than one tenth of GDP in Palestine, the highest share among southern European neighbourhood policy countries and the only one to record a share higher than the EU average (9.9 %).
In 2017, among the southern European neighbourhood policy countries, Israel had the highest share of population connected to public water supply and urban wastewater collecting systems.
(ratio)
Source: Eurostat (ilc_di11) and (med_ps313)
This article is part of an online publication and provides data for a range of statistics covering living conditions for eight of the countries that form the European Neighbourhood Policy-South (ENP-South) region, namely, Algeria, Egypt, Israel, Jordan, Lebanon, Morocco, Palestine [1] and Tunisia; no recent data are available for Libya or Syria.
The article includes information relating to income distribution, the risk of poverty (before and after social transfers), health and social protection expenditure, and the proportion of the population that is connected to the public water supply and urban wastewater collecting system.
Full article
Income distribution
The income quintile share ratio, also known as the S80/S20 ratio, is a measure of the inequality of income distribution. It is calculated as the ratio of the total income received by the 20 % of the population with the highest incomes (the top quintile) to that received by the 20 % of the population with the lowest incomes (the bottom quintile). Incomes are equivalised to take account of the varying composition of households.
Figure 1 shows that the cumulative income of the top population quintile in the EU-28 was 5.1 times the size of the cumulative income of the bottom population quintile in 2017, a similar ratio to that observed in 2007 (5.0 %; data excluding Croatia). In 2017, there was a somewhat higher degree of income inequality — using this measure — in Israel, where the income quintile share ratio was 6.9. By contrast, there was a lower level of inequality in Palestine, where the ratio was 3.6. Recent data are not available for the other ENP-South countries, although it is uncommon to see rapid changes for this measure. Based on the latest data available, the degree of income inequality in Algeria and Egypt was slightly lower than in the EU-28, while in Jordan it was much lower. On the other hand, the highest measure of income inequality was recorded in Morocco.
Between the years shown in Figure 1, the income quintile share ratio rose somewhat in Egypt and by a minimal degree in Jordan and Palestine, while there was a reduction in the level of inequality in Israel between 2012 and 2017.

(ratio)
Source: Eurostat (ilc_di11) and (med_ps313)
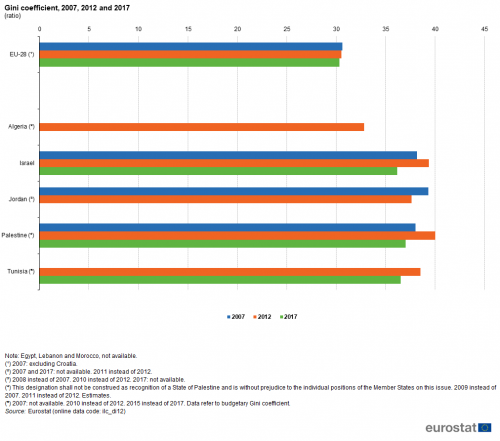
The Gini coefficient is an alternative measure of income inequality. It shows the extent to which all incomes within the population differ from the average income: the closer the coefficient is to 100 the less equal are the incomes, while the closer it is to 0 the more equal are the incomes. In the EU-28, the Gini coefficient in 2017 was 30, around the same as it had been in 2007 (excluding Croatia).
Each of the ENP-South countries for which data are available reported a Gini coefficient that was somewhat higher than the average for the EU-28. Algeria had the lowest Gini coefficient (33; 2011 data), while Israel (2017 data), Tunisia (2015 data), Palestine (2017 data) and Jordan (2010 data) each recorded Gini coefficients within the range of 36-38.
Between 2012 and 2017 there was a marginal reduction in the EU-28 Gini coefficient. Relatively fresh data for a comparison over the same period are only available for three of the ENP-South countries — Israel, Palestine (2011-2017) and Tunisia (2010-2015) — each of which recorded a more sizeable reduction in their respective Gini coefficients (see Figure 2).
Monetary poverty
The poverty threshold used for the data in Figures 3 and 4 is set at 60 % of the national median equivalised disposable income (after social transfers). The total net income of each household is calculated by adding together the income received by all the members of the household from all sources. For each person, the equivalised total net income is calculated as the household’s total net income divided by the equivalised household size, generally based on the modified OECD scale: a weight of 1.0 for the first adult, 0.5 for other persons aged 14 or over who are living in the household and 0.3 for each child aged less than 14. The poverty threshold is shown as a monthly income, in 2017 it stood at EUR 1 048 in Israel.
The at-risk-of-poverty rate is the proportion of the population with an equivalised disposable income below the at-risk-of-poverty threshold. This indicator can be calculated either before or after social transfers, the difference reflecting the proportion of the population moved above the threshold as a result of receiving social transfers. Social transfers cover the social help given through benefits such as: old-age and survivors’ (typically widows’ and widowers’) pensions; unemployment, family-related, sickness and invalidity, education-related and other benefits; housing allowances; social assistance.
(%)
Source: Eurostat (ilc_li02)
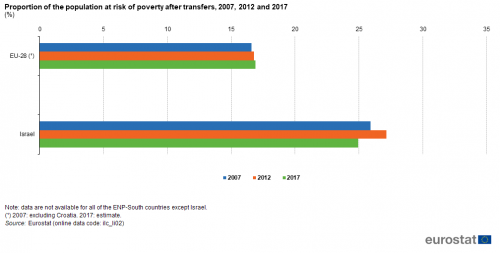
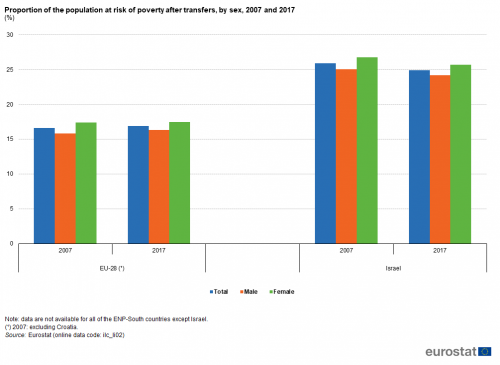
As the poverty threshold is set independently for each country, at-risk-of-poverty indicators reflect low incomes in comparison with other residents of the same country, which do not necessarily imply a low standard of living. In the EU-28, 43.9 % of the population were at risk of poverty before taking account of social transfers in 2017, with this share dropping to 16.9 % as a consequence of social transfers. Data concerning the at-risk-of-poverty rate after transfers are only available for Israel among the ENP-South countries: the risk of poverty in Israel was higher than in the EU-28 for both men and women in 2017 (as it had been a decade earlier in 2007).
Between 2007 and 2017, the proportion of the EU-28 population at risk of poverty after transfers increased slightly: the share increased from 16.6 % (excluding Croatia) to 16.9 %. By contrast, in Israel the proportion of the population at risk of poverty initially rose between 2007 and 2012 from 25.9 % to 27.2 %, before falling back to 24.9 %, in other words below the 2007 level (see Figure 3).
A more detailed picture of the situation in the EU and Israel — with an analysis by gender — is presented in Figure 4. It shows that the risk of poverty was systematically lower for men than it was for women in both 2007 and 2017 for both the EU-28 (2007 data are excluding Croatia) and Israel. The risk of poverty was 1.6 percentage points higher for women than men in the EU-28 in 2007, with this gender gap narrowing somewhat to 1.2 points a decade later. A similar development was observed in Israel where the risk of poverty among women was 1.7 points higher than for men in 2007, with the gap between the genders falling to 1.5 points a decade later.
(%)
Source: Eurostat (ilc_li02)
Health and social protection expenditure
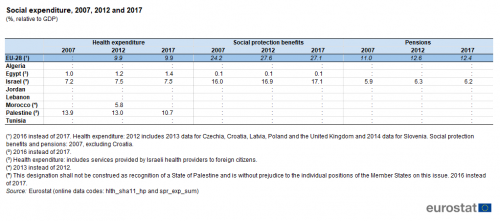
Expenditure on health concerns current expenditure on health and investment, regardless of the source of funds. It covers: curative and rehabilitative care (in-patient care, day cases, out-patient and home care); services of long-term nursing care (in-patient, day cases and home care); ancillary services to health care; medical goods dispensed to out-patients; services of prevention and public health; health administration and health insurance. The level of expenditure on health relative to gross domestic product (GDP) ranged greatly between those ENP-South countries for which data are available in 2017 (see Table 1), from a low of 1.4 % of GDP in Egypt (2016 data) to a high of 10.7 % in Palestine (2016 data); as such, Palestine was the only ENP-South country to report a ratio of health expenditure (relative to GDP) that was higher than in the EU-28 (9.9 %; 2016 data).
(%, relative to GDP)
Source: Eurostat (hlth_sha11_hp) and (spr_exp_sum)
Social protection expenditure comprises social protection benefits, administration costs and other expenditure: the data shown in Table 1 only concerns benefits. Social benefits consist of transfers, in cash or in kind, by social protection schemes to households and individuals to relieve them of the burden of a defined set of risks or needs, provided that there is neither a simultaneous reciprocal nor an individual arrangement involved. The list of risks or needs is fixed as: sickness/health care; disability; old-age; survivors; family/children; unemployment; housing; and other social exclusion. Note that not all health expenditure falls within social protection expenditure. Note also that pensions form one of the principal social protection benefits (expenditure on pensions, as shown in Table 1, forms part of the broader social protection benefits aggregate).
In 2016, expenditure on social protection benefits in the EU-28 was equivalent to more than one quarter (27.1 %) of GDP. This level was higher than in Israel (17.1 %; 2017 data) and much higher than in Egypt (0.1 %; 2016 data).
Between 2007 and 2016, the ratio of EU-28 expenditure on social protection benefits to GDP increased from 24.2 % (data excluding Croatia) to 27.1 %. Israel also reported an increase in this ratio over a similar period of time (2007-2017).
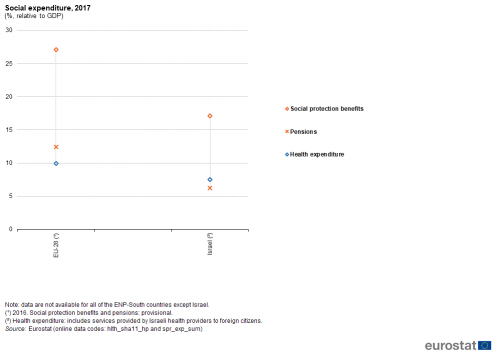
One underlying factor that may explain part of the increase of expenditure on social protection benefits in the EU-28 as well as elsewhere is an increase in pension payments, which may be linked to an ageing population and hence a growing number of pensioners. Between 2007 (data excluding Croatia) and 2016, the ratio of social protection expenditure on pensions relative to GDP rose from 11.0 % to 12.4 % in the EU-28, an increase of 1.4 percentage points. Israel was the only ENP-South country for which relatively recent and complete data are available, with the share of expenditure on pension payments rising from 5.9 % to 6.2 % of GDP during the period 2007-2017 (see Figure 5).
Pensions accounted for just under half (46 %) of the total expenditure on social protection benefits in the EU-28 in 2016. By contrast, in Israel the share of pensions was slightly higher than one third (36 %) in 2017.
(%, relative to GDP)
Source: Eurostat (hlth_sha11_hp) and (spr_exp_sum)
The public water supply is water supplied by all economic entities engaged in collecting, purifying and distributing water. This definition includes the desalting of sea water (particularly relevant for some ENP-South countries, for example, Israel), but excludes system operation for agricultural purposes and the treatment of wastewater solely to prevent pollution.
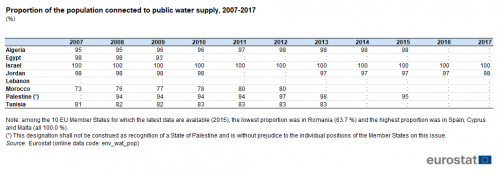
In most of the ENP-South countries for which data are available, a relatively high proportion of the population was connected to the public water supply (see Table 2). Indeed, the share peaked at 100 % in Israel (2017 data) and was also at least 95 % in Jordan (2017 data), Algeria and Palestine (both 2015 data). Among those ENP-South countries that had lower shares of their respective populations connected to the public water supply, it was common to find that shares were increasing slowly over time, as was the case for example in Morocco and Tunisia.
(%)
Source: Eurostat (env_wat_pop)
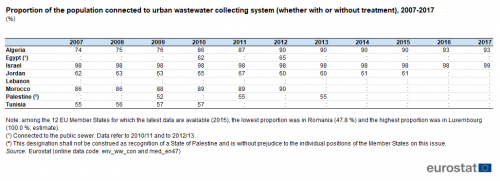
Table 3 shows the proportion of the population connected to the urban wastewater collecting system (whether with or without treatment). In most of the ENP-South countries, a lower share of the population was connected to these services when compared with the data for people connected to the public water supply. In 2017, almost the entire population (99 %) of Israel was connected to an urban wastewater collecting system; Algeria (93 %) and Morocco (90 %; 2012 data) were the only other ENP-South countries to report at least 9 out of 10 people connected to these services. At the other end of the range, just over half (55 %; 2013 data) of the population in Palestine was connected to the urban wastewater collecting system, while Tunisia (2010 data), Jordan (2015 data) and Egypt (2012 data; note there is a difference in coverage) each recorded shares between 57 % and 65 %.
(%)
Source: Eurostat (env_ww_con) and (med_en47)
Source data for tables and graphs
Data sources
The data for ENP-South countries are supplied by and under the responsibility of the national statistical authorities of each country on a voluntary basis. The data that are presented in this article result from an annual data collection cycle that has been established by Eurostat. No recent data are available from either Libya or Syria. These statistics are available free-of-charge on Eurostat’s website, together with a range of different indicators covering most socio-economic areas.
EU statistics on income and living conditions (EU-SILC) is an instrument that aims to collect timely and comparable data on income, poverty, social inclusion and living conditions, in both monetary and non-monetary terms. The data are generally collected for private households and household members. EU-SILC provides both cross-sectional data and longitudinal data (typically over a four-year period). The legal basis for this data collection exercise is the Regulation of the European Parliament and of the Council (EC) No 1177/2003 concerning Community statistics on income and living conditions (EU-SILC); it is supported by a series of implementing regulations and special data collection modules that relate to the collection of secondary variables on a less regular basis.
The European system of integrated social protection statistics (ESSPROS) is a common framework developed within the European Statistical System (ESS) that has been designed to provide a coherent comparison across European countries (28 EU Member States plus Iceland, Norway, Switzerland, Serbia and Turkey) of social benefits to households and their financing, in terms of precisely defined risks or needs that refer to the ESSPROS functions: disability, sickness/health care, old-age, survivors, family/children, unemployment, housing and social exclusion. The legal basis for the data collection exercise is provided by Regulation (EC) No 458/2007 of the European Parliament and of the Council on the European system of integrated social protection statistics (ESSPROS). ESSPROS is composed of a core system that contains annual data from 1990 onwards on (gross) expenditures and receipts. In addition to the core system, one module on pension beneficiaries and one on net social benefits data are available.
Tables in this article use the following notation:
| Value in italics | data value is forecasted, provisional or estimated and is therefore likely to change; |
| : | not available, confidential or unreliable value; |
| – | not applicable. |
Context
Social protection systems are generally well-developed in the EU: they are designed to protect people (to some degree) against the risks and needs associated with unemployment, parental responsibilities, sickness/health care and invalidity/disability, the loss of a spouse or parent, old-age, housing and other forms of social exclusion.
The main policy framework in this domain concerns the open method of coordination (OMC) for social protection and social inclusion, which aims to promote social cohesion and equality, through adequate, accessible and financially sustainable social protection systems and social inclusion policies. A Communication from the European Commission Working together, working better: a new framework for the open coordination of social protection and inclusion policies in the European Union (COM(2005) 706 final) outlines the objectives, which include:
- making a decisive impact on the eradication of poverty and social exclusion;
- providing adequate and sustainable pensions;
- ensuring accessible, high-quality and sustainable healthcare and long-term care.
On 18 November 2015, the High Representative for Foreign Affairs and Security Policy and the European Commission jointly presented a review of the European Neighbourhood Policy (SWD(2015) 500 final) which underlined a new approach for the EU in relation to its eastern and southern neighbours, based on stabilising the region in political, economic, and security-related terms.
In cooperation with its ENP partners, Eurostat has the responsibility ‘to promote and implement the use of European and internationally recognised standards and methodology for the production of statistics necessary for developing and monitoring policy achievements in all policy areas’. Eurostat undertakes the task of coordinating EU efforts to increase the statistical capacity of the ENP countries. Additional information on the policy context of the ENP is provided here.
Direct access to
Books
Leaflets
- International trade in goods for the European neighbourhood policy-South countries — 2018 edition
- Energy and transport statistics for the European neighbourhood policy-South countries — 2018 edition
- Basic figures on the European Neighbourhood Policy — South countries — 2018 edition
- Basic figures on the European Neighbourhood Policy — South countries — 2016 edition
- Labour force statistics for the Mediterranean region — 2016 edition
- Basic figures on the European Neighbourhood Policy — South countries — 2015 edition
- Population and social conditions (med_ps)
- People at risk of poverty or social exclusion (Europe 2020 strategy) (ilc_pe)
- Income distribution and monetary poverty (ilc_ip)
- Living conditions (ilc_lv)
- Water (env_wat), see:
- Water statistics on national level (env_nwat)
- Southern European Neighbourhood Policy countries (ENP-South) (med) (ESMS metadata file — med_esms)
- Income and living conditions (ESMS metadata file — ilc)
- Water statistics on national level (ESMS metadata file — env_nwat)
- Directorate-General for Employment, Social Affairs and Inclusion
- Directorate-General for Employment, Social Affairs and Inclusion — Social protection and social inclusion
- European External Action Service — Middle East and North Africa (MENA)
- European External Action Service — European Neighbourhood Policy
Notes
- ↑ This designation shall not be construed as recognition of a State of Palestine and is without prejudice to the individual positions of the Member States on this issue.
