Archive:EU-ASEAN cooperation - key population statistics
Revision as of 11:26, 30 May 2017 by EXT-S-Allen (talk | contribs)
- Data extracted in March and April 2017. Most recent data: Further Eurostat information, Database.
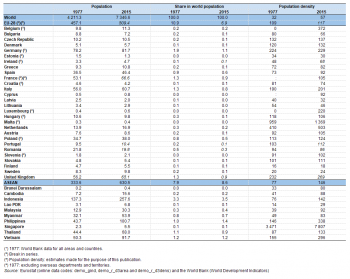
Table 1: Key data on population, 1977 and 2015
Source: Eurostat (demo_gind), (demo_r_d3area) and (demo_r_d3dens) and the World Bank (World Development Indicators)
Source: Eurostat (demo_gind), (demo_r_d3area) and (demo_r_d3dens) and the World Bank (World Development Indicators)
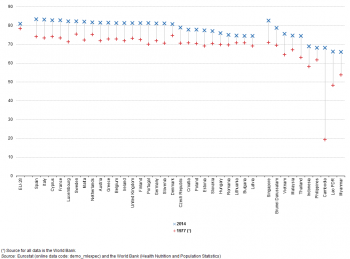
Figure 1: Life expectancy at birth, 1977 and 2014
(years)
Source: Eurostat (demo_mlexpec) and the World Bank (Health Nutrition and Population Statistics)
(years)
Source: Eurostat (demo_mlexpec) and the World Bank (Health Nutrition and Population Statistics)
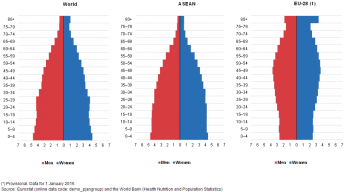
Figure 2: Age pyramids, 2015
(% of total population)
Source: Eurostat (demo_pjangroup) and the World Bank (Health Nutrition and Population Statistics)
(% of total population)
Source: Eurostat (demo_pjangroup) and the World Bank (Health Nutrition and Population Statistics)
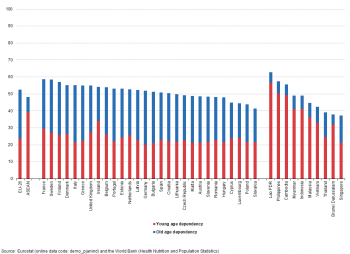
Figure 3: Dependency ratios, 2015
(%)
Source: Eurostat (demo_pjanind) and the World Bank (Health Nutrition and Population Statistics)
(%)
Source: Eurostat (demo_pjanind) and the World Bank (Health Nutrition and Population Statistics)

Figure 4: Crude birth rate, 1977 and 2014
(per 1 000 inhabitants)
Source: Eurostat (demo_gind) and the World Bank (Health Nutrition and Population Statistics)
(per 1 000 inhabitants)
Source: Eurostat (demo_gind) and the World Bank (Health Nutrition and Population Statistics)
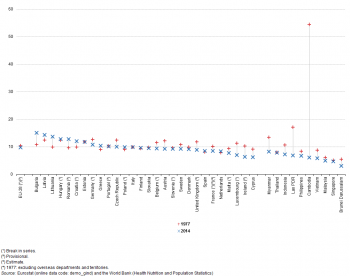
Figure 5: Crude death rate, 1977 and 2014
(per 1 000 inhabitants)
Source: Eurostat (demo_gind) and the World Bank (Health Nutrition and Population Statistics)
(per 1 000 inhabitants)
Source: Eurostat (demo_gind) and the World Bank (Health Nutrition and Population Statistics)
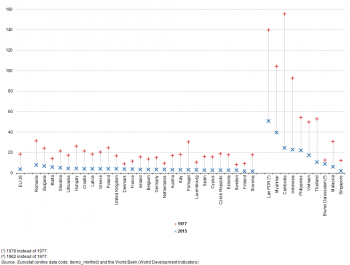
Figure 6: Infant mortality rate, 1977 and 2015
(per 1 000 live births)
Source: Eurostat (demo_minfind) and the World Bank (World Development Indicators)
(per 1 000 live births)
Source: Eurostat (demo_minfind) and the World Bank (World Development Indicators)

Table 2: Largest urban agglomerations in EU-28 and ASEAN members, 1975–2025
(million inhabitants)
Source: Eurostat (demo_minfind)Source: the United Nations, Department of Economic and Social Affairs, Population Division (World Urbanisation Prospects)
(million inhabitants)
Source: Eurostat (demo_minfind)Source: the United Nations, Department of Economic and Social Affairs, Population Division (World Urbanisation Prospects)
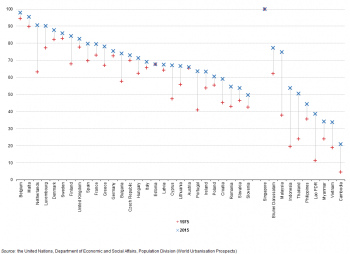
Figure 7: Share of urban population, 1975 and 2015
(% of total population)
Source: Eurostat (demo_minfind)Source: the United Nations, Department of Economic and Social Affairs, Population Division (World Urbanisation Prospects)
(% of total population)
Source: Eurostat (demo_minfind)Source: the United Nations, Department of Economic and Social Affairs, Population Division (World Urbanisation Prospects)
See also
- Asia-Europe Meeting (ASEM) — a statistical portrait — online publication
- Asia-Europe Meeting (ASEM) and EU — key statistical indicators
- 40 years of EU-ASEAN Cooperation – key statistics — online publication
- EU trade and investment statistics with the Association of South East Asian Nations (ASEAN)
- South Korea-EU — trade in goods
- The EU in the world
Further Eurostat information
Publications
- ASEM partners accounted for 44% of EU28 imports and 30% of exports in 2013 — News release October 2014
- EU-South Korea trade relations boosted by the recent free trade agreement — Statistics in focus 1/2015
- EU trade in goods with India in slight deficit in 2015 for a third consecutive year — News release March 2016
- From birth to death: a closer look at business demography in selected EU countries and the Republic of Korea — Statistics in focus 1/2014
- Goods trade with ASEAN countries rebounds from 2009 to 2010 — Statistics in focus 47/2011
- The EU in the world 2013 — A statistical portrait — Statistical book (2013)
- The European Union and the BRIC countries — Pocketbook (2012)
- The European Union and the Republic of Korea — A statistical portrait — Statistical book (2012)
Database
- Balance of payments, see:
- Balance of payments - International transactions (BPM6) (bop_6)
- European Union direct investments (BPM6) (bop_fdi6)
- EU direct investment flows, breakdown by partner country and economic activity (BPM6) (bop_fdi6_flow)
- European Union direct investments (BPM6) (bop_fdi6)
- Government statistics (gov), see:
- Government finance statistics (EDP and ESA2010) (gov_gfs10)
- Annual government finance statistics (gov_10a)
- Government revenue, expenditure and main aggregates (gov_10a_main)
- Government deficit and debt (gov_10dd)
- Government deficit/surplus, debt and associated data (gov_10dd_edpt1)
- Annual government finance statistics (gov_10a)
- Harmonised indices of consumer prices (HICP) (prc_hicp)
- HICP (2005 = 100) - annual data (average index and rate of change) (prc_hicp_aind)
- Annual national accounts (nama_10)
- Main GDP aggregates (nama_10_ma)
- GDP and main components (output, expenditure and income) (nama_10_gdp)
- Basic breakdowns of main GDP aggregates and employment (by industry and by assets) (nama_10_bbr)
- Gross value added and income by A*10 industry breakdowns (nama_10_a10)
- Main GDP aggregates (nama_10_ma)
Dedicated section
- Balance of payments
- Government finance and EDP statistics
- Harmonised Index of Consumer Prices (HICP)
- International Statistical Cooperation
- National accounts (including GDP)
Source data for tables (MS Excel)
External links
- European Commission – DG International Development and Cooperation — EuropeAid: Building strong and lasting links with Asia
- European Commission — EU-ASEAN Brochure
- European Commission — EU-ASEAN Trade & Investment booklet
[[Category:<Asia>|EU-ASEAN cooperation - key population statistics]] [[Category:<Balance of payments>|EU-ASEAN cooperation - key population statistics]] [[Category:<GDP by area and region>|EU-ASEAN cooperation - key population statistics]] [[Category:<Government finance statistics>|EU-ASEAN cooperation - key population statistics]] [[Category:<Government finance by area>|EU-ASEAN cooperation - key population statistics]] [[Category:<National accounts (incl. GDP)>|EU-ASEAN cooperation - key population statistics]] [[Category:<Non-EU_countries>|EU-ASEAN cooperation - key population statistics]] [[Category:<Statistical article>|EU-ASEAN cooperation - key population statistics]]