.PNG)
.PNG&body=Statistics Explained - Taxes and social contributions, EU-27, 1998-2008 (% of GDP).PNG %0A https%3A%2F%2Fec.europa.eu%2Feurostat%2Fstatistics-explained%2Findex.php%3Ftitle%3DFile%3ATaxes_and_social_contributions%2C_EU-27%2C_1998-2008_%28%2525_of_GDP%29.PNG)
File:Taxes and social contributions, EU-27, 1998-2008 (% of GDP).PNG
.PNG&diff=prev&oldid=24922)
.PNG&direction=prev&oldid=24922)
.PNG)
.PNG&diff=cur&oldid=24922)
.PNG&direction=next&oldid=24922)
.PNG&diff=next&oldid=24922)
No higher resolution available.
Taxes_and_social_contributions,_EU-27,_1998-2008_(%_of_GDP).PNG (668 × 259 pixels, file size: 17 KB, MIME type: image/png)
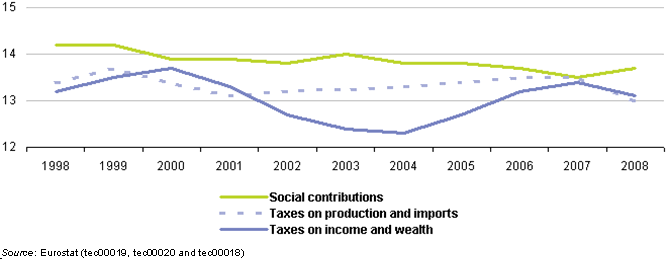
Taxes and social contributions, EU-27, 1998-2008
- (% of GDP)
Graph created with data from September 2009
Most recent data available now, see:
Social contributions - (% of GDP) (tec00019)
Taxes on production and imports - (% of GDP) (tec00020)
Current taxes on income, wealth, etc. - (% of GDP) (tec00018)
File usage
There are no pages that use this file.
.PNG&oldid=24922)
.PNG&action=edit&redlink=1)
.PNG&action=history)