Archive:Energy price statistics
- Data from September 2009, most recent data: Further Eurostat information, Main tables and Database.
Ever increasing energy demand, the global geopolitical situation and severe weather conditions have induced rapid and large changes in energy prices in the European Union (EU).
This article highlights the evolution of electricity and gas prices for both industrial and household users and considers the impact of higher prices for crude oil. It also discusses the importance of energy prices to international competitiveness and demonstrates the wide range of prices for electricity within the EU.
Main statistical findings
Electricity and gas
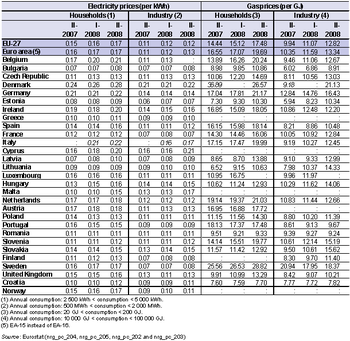
Due to a change in methodology, there is a break in series and hence a relatively short time series available in relation to electricity and gas prices (from 2007 onwards). Nevertheless, even in this relatively short timeframe, electricity and gas prices have increased rapidly – in particular, gas prices. Between the second half of 2007 and the second half of 2008, both electricity and gas prices increased for households and industrial users in nearly all of the Member States. On average across the EU the price of electricity for households rose by 9.6 %, while gas prices increased by 21.1 %. The price increases experienced by industrial users in the EU over the same period were even higher – 13.8 % for electricity and 28.9 % for gas. There were a few notable exceptions to these trends, as the price of electricity for households fell in Poland (-6.2 %), Romania (-3.3 %), Luxembourg and Portugal (both -2.2 %), while gas prices fell in Denmark (-28.0 %), Portugal (-3.6 %) and Romania (-1.9 %).
In the second half of 2008, the price of electricity for households was nearly three and a half times higher in the most expensive Member State, Denmark (EUR 0.28 per kWh), than in the cheapest Member State, Bulgaria (EUR 0.08 per KWh). The range of prices for gas was similar in magnitude, as the highest prices for households were registered in Sweden (EUR 28.82 per GJ), at more than three times the lowest price recorded in Romania (EUR 9.33 per GJ). Household gas prices were also significantly higher in Denmark (EUR 26.57 per GJ) than in any of the other Member State (except Sweden), despite considerable price reductions. A large part of the energy price differences between the Member States may be attributed to taxes, as the range in prices between countries is narrower when taxes are excluded.
Petrol and diesel
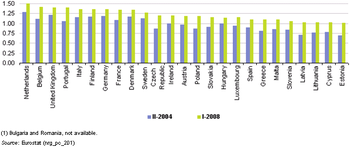
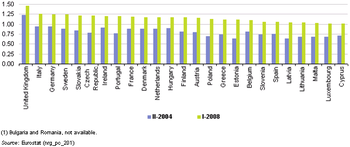
As with electricity and gas prices, petrol and diesel prices have also risen in recent years. The highest prices for unleaded petrol in the EU during the first half of 2008 were found in the Netherlands, Belgium, Portugal and the United Kingdom, while the United Kingdom had, by some margin (EUR 0.20 per litre), the most expensive pump price for automotive diesel oil. While petrol and diesel prices rose considerably between the second half of 2004 and the first half of 2008, reflecting the evolution of crude oil markets, the range between the highest and lowest pump prices in the Member States narrowed (as variable taxes accounted for a lower share of the overall price). The lowest prices for petrol and diesel were recorded in the Baltic Member States, the islands of Cyprus and Malta, and in Slovenia, while diesel oil was also relatively cheap in Luxembourg and Spain.
Data sources and availability
The transparency of gas and electricity prices should help promote fair competition, by encouraging consumers to choose between different energy sources (oil, coal, natural gas and renewable energy sources) and between different suppliers. For energy price transparency to be truly effective, prices and pricing systems must be published and broadcast as widely as possible.
The transparency of energy prices is guaranteed within the EU through the obligation of gas and electricity suppliers to send Eurostat information relating to prices for different categories of end-consumer (businesses and households), market shares, conditions of sale, and pricing systems. Electricity and gas tariffs or price schemes vary from one supplier to another. They may result from negotiated contracts, especially for large industrial consumers. For smaller consumers, they are generally set according to the amount of electricity or gas consumed along with a number of other characteristics; most tariffs also include some form of fixed charge. There is, therefore, no single price for electricity or gas. In order to compare prices over time and between countries, this publication shows information for two ‘standard consumers’ – one for domestic consumers and the other for industrial users. There are in total five different types of households for which electricity prices are collected following different annual consumption bands, while for natural gas prices statistics are collated for three different types of household. Across business/industrial users, electricity prices are collected for a total of seven different types of user, while for natural gas prices there are six different types of user distinguished.
Statistics on electricity and natural gas prices charged to industrial end-users are collected under the legal basis of Commission Decision 2007/394/EC of 7 June 2007 amending Council Directive 90/377/EEC with regard to the methodology to be applied for the collection of gas and electricity prices. Directive 2008/92/EC of 22 October 2008 concerns procedures to improve the transparency of gas and electricity prices charged to industrial end-users. Note that gas and electricity prices for household end-users are collected on a voluntary basis.
The prices presented cover average prices over a period of six months (half-year/semester) from January to June and from July to December. The prices include the basic price of electricity/gas, transmission, system services, distribution and other services. Electricity prices for households are normally shown including taxes and value added tax (VAT) as this generally reflects the end price paid by consumers at home. All electricity price data are given in euro per kilowatt hour (KWh); a similar set of criteria are used for gas prices, except the unit changes to euro per gigajoule (GJ). For the purpose of comparison, industrial gas and electricity prices are also shown including taxes, although in practice enterprises can deduct the VAT paid.
Automotive fuel prices shown are at the pump prices of premium unleaded gasoline (petrol) 95 RON and automotive diesel oil. The prices are supplied to the Directorate-General for Energy and Transport of the European Commission by the Member States as being the most frequently encountered on the 15th of each month; as with gas and electricity prices these are averaged for a period of six months (half-year/semester); equally, the prices that are shown are inclusive of all taxes. Eurostat also publishes price information on heating oil and residual fuel oil.
Context
The price and reliability of energy supplies, electricity in particular, are key elements in a country’s energy supply strategy. It is particularly important for a country's international competitiveness as electricity usually represents a high proportion of total energy costs to households and businesses. In contrast to the price of fossil fuels, which are usually traded on global markets with relatively uniform prices, there is a particularly wide range of prices within the EU for electricity. The price of electricity is, to some degree, influenced by the price of primary fuels and, more recently, by the cost of carbon dioxide (CO2) emission certificates. It is possible that the resulting higher prices for electricity will provide an incentive for greater energy efficiency and lower levels of carbon emissions.
These issues were touched upon in a Communication from the European Commission titled, ‘Facing the challenge of higher oil prices’, which called on the EU to become more efficient in its use of energy, and less dependent on fossil fuels – in particular by following the approach laid out in the climate change and renewable energy package.
The EU has acted to liberalize electricity and gas market since the second half of the 1990s. Directives adopted in 2003 established common rules for internal markets for electricity and natural gas. Deadlines were set for opening markets and allowing customers to choose their supplier: 1 July 2004 for all business customers and 1 July 2007 for all consumers (including households). Certain countries anticipated the liberalisation process, while others were much slower in adopting the necessary measures. Indeed, significant barriers to entry remain in many electricity and natural gas markets as seen through the number of markets that are still dominated by (near) monopoly suppliers. In July 2009, the European Parliament and Council adopted a third package of legislative proposals aimed at ensuring a real and effective choice of suppliers, as well as benefits for customers.
Further Eurostat information
Publications
- Gas and electricity market statistics
- Panorama of energy: energy statistics to support EU policies and solutions
Main tables
- Energy(t_nrg), see
- Energy Statistics - prices (t_nrg_price)
- Prices of premium unleaded gasoline 95 RON (ten00102)
- Prices of diesel oil (ten00103)
- Gas prices by type of user (tsier050)
- Natural gas prices for large industrial standard consumers (ten00104)
- Electricity prices by type of user (tsier040)
- Electricity prices for large industrial standard consumers (ten00105)
Database
- Energy (nrg), see:
- Energy Statistics - prices (nrg_price)
- Energy Statistics: gas and electricity prices - New methodology from 2007 onwards (nrg_pc)
- Energy Statistics: gas and electricity prices - Old methodology until 2007 (nrg_pc_h)
- Gas and electricity prices for structural indicators - prices on 1st January (1991-...) (nrg_pc_priceind)
- Petroleum products - half-yearly prices (nrg_pc_201)
External links
- Eurelectric - Electricity for Europe - Statistics
- European Commission - Energy - Gas & Electricity - Electricity Regulatory Forum (Florence)
- European Commission - Energy - Gas & Electricity - Gas Regulatory Forum
- International Energy Agency


