Archive:Sustainable development - climate change and energy
- Data from July 2009, most recent data: Further Eurostat information, Database.
This article provides an overview of statistical data on sustainable development in the areas of climate change and energy. They are based on the set of sustainable development indicators the European Union (EU) agreed upon for monitoring its sustainable development strategy. Together with similar indicators for other areas, they make up the report 'Sustainable development in the European Union - 2009 monitoring report of the EU sustainable development strategy', which Eurostat draws up every two years to provide an objective statistical picture of progress towards the goals and objectives set by the EU sustainable development strategy and which underpins the European Commission’s report on its implementation.
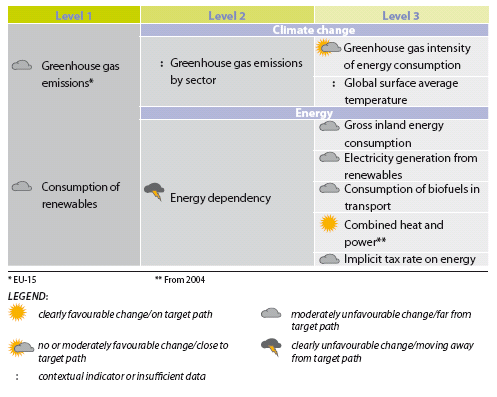
The table below summarizes the state of affairs of in the area of climate change and energy. Quantitative rules applied consistently across indicators, and visualized through weather symbols, provide a relative assessment of whether Europe is moving in the right direction, and at a sufficient pace, given the objectives and targets defined in the strategy.
Overview of main changes
Overall progress since 2000 in the ‘climate change and energy’ theme has been unfavourable, even if there are recent signs of improvement in several indicators.
Following a period of growth in EU-15 greenhouse gas emissions between 2000 and 2004, recent developments have been favourable, and emissions in 2007 stood 1.4 % lower than in 2000. Projections indicate that the Kyoto Protocol targets are within reach. The greenhouse gas intensity of energy consumption has increased, but at a modest pace.
Of the energy indicators, only combined heat and power has shown a favourable development. The consumption of renewables and biofuels as well as the share of renewables in electricity generation have increased but each at a pace which appears insufficient to reach their respective targets. Energy dependency has grown considerably since 2000, reaching about 55 % in 2008. The implicit tax rate on energy has fallen, which is inconsistent with the objective of shifting the tax burden from labour to resource use.
Headline indicator
Progress in reducing greenhouse gas emissions has been slow since 2000, but trends are projected to become favourable
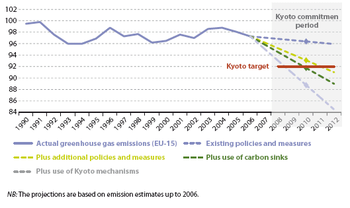
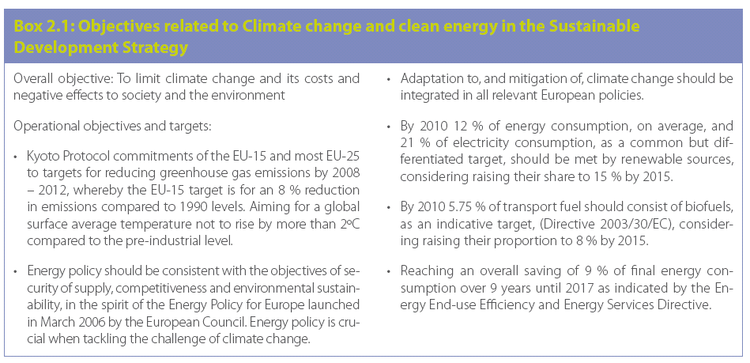
EU-15 greenhouse gas emissions in 2007 stood 5 % below their Kyoto base year value, and although remaining above the 8 % reduction required by Kyoto between 2008 and 2012 are moving towards it. Since 2004 the evolution has been favourable, resulting in an overall decrease of 1.4 % for the EU-15 between 2000 and 2007. According to the projections compiled by the European Environment Agency (EEA) the Kyoto target should be reached with existing policies and measures, including the use of carbon sinks. With additional policies and measures, and use of the so-called ‘Kyoto mechanisms’, the EU-15 is projected to overachieve its target.
EU-27 emissions, for which there is no Kyoto target, were virtually the same in 2007 as in 2000. Following the considerable progress achieved in reducing greenhouse gas emissions by eastern European Member States during the 1990s, emissions rose in the first years of the decade but have fallen steadily since 2004, so that in 2007 EU-27 emissions were 12.5 % below their base year level.
Slow progress in the uptake of renewable sources
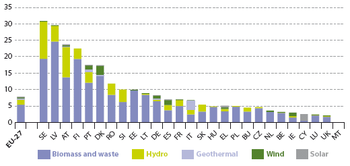
Despite increases in the consumption of renewable energies in the EU‑27 since 2000, their share in inland energy consumption has not grown sufficiently to be on the target path. Biomass is by far the most important renewable energy source, delivering almost 70 % of the total renewable energy in 2007 and having the fastest growing share. Hydro power, the second most important renewable energy source, has decreased its share over recent years. Wind and geothermal sources are still minor contributors, although in absolute terms are increasing rapidly.
Climate change
Growing energy industry and transport emissions
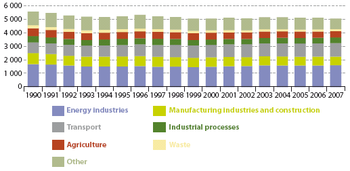
Although emissions from most sectors decreased between 2000 and 2007, emissions from energy industries and transport, the two biggest emission sources, increased, thereby offsetting some of the reductions achieved elsewhere.
Even if emissions from the energy industry have increased, due to switching to lower carbon fuels the greenhouse gas intensity of energy consumption has decreased, albeit at a slower pace than in the 1990s.
Modest decline in GHG intensity of energy consumption
The global surface average temperature was 0.7 °C higher in 2008 than 150 years ago, although there are indications that over the past decade the rate of global temperature rise has slowed down.
Energy
EU is dependent on imports for more than half of its energy
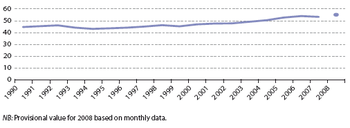
EU-27 dependence on imported energy remained rather constant during the 1990s at around 45 %. Since 2000, the level of energy dependency has risen steeply, exceeding 50 % in 2004, and reaching around 55 % in 2008.
Energy demand has slightly increased
The EU’s energy demand has slightly grown. Between 2000 and 2007 EU-27 energy consumption grew faster than in the previous decade, although since 2003 it has levelled off. There has been a general shift away from solid fuels towards natural gas and to some extent renewable energies.
Share of renewable electricity needs faster growth to reach target
The share of renewables in EU-27 electricity production grew from 13.8 % in 2000 to 15.6 % in 2007, but remains below the path to the 21 % target set for 2010.
The share of biofuels remains small but is rapidly growing
The share of biofuels in transport remains small but is growing rapidly. Their consumption has shown accelerated growth since 2000, and they represented 2.6 % of transport fuels in 2007 in EU-27. Although this share is still below the target path, if the recent rate of growth continues the target is attainable.
Modest progress in combined heat and power generation
The development of cogeneration or combined heat and power (CHP), a technology which combines the production of useful heat with electricity generation, has been relatively slow. The EU-27 share in gross electricity generation increased only slightly, by 0.2 percentage points per year between 2004 and 2007. CHP delivered 10.9 % of gross electricity generation in 2007.
Implicit tax rate has been declining
The implicit tax rate on energy for the EU-27 has been decreasing since 1999. This decrease in the effective tax burden could be seen as inconsistent with the objective of shifting taxation from labour onto resource and energy consumption, although there are indications that taxation may have played a role in stimulating energy conservation. Furthermore there is greater reliance on policy instruments other than taxes, such as emissions trading, and energy taxes were reduced to compensate for the substantial rise in the oil price over recent years.
Main statistical findings
Greenhouse gas emissions
Between 2000 and 2007 EU-15 greenhouse gas emissions have remained above the target path. However, since 2004 emissions have reduced appreciably and are moving towards the target
Analysis
- Although EU greenhouse gas emissions grew over the period from 2000 to 2004, the trend over the last three years has been favourable
Between 1990 and 2007, the EU-15 reduced greenhouse gas emission by 5.0 %; leaving it 3 percentage points from its reduction target for 2008-12. Although emissions rose during the first few years of the century, they have been decreasing since 2004. Overall, between 2000 and 2007, emissions decreased, but at a somewhat slower rate than over the previous decade.
According to the projections compiled by the European Environment Agency the Kyoto target should be reached with existing policies and measures, including the use of carbon sinks. With additional policies and measures and use of the so-called ‘Kyoto mechanisms’ the EU-15 is projected to overachieve its target.
In addition to the Kyoto Protocol commitment for EU-15, the EU as a whole is committed to achieving at least a 20 % reduction of its greenhouse gas emissions by 2020 compared to 1990 levels. In EU-27 emissions were 12.5 % lower than their base year level, but the major part of these reductions were made prior to 2000. Emissions in 2007 remained at virtually the same level as in 2000. According to the projections compiled by the European Environment Agency, the EU-27 is not likely to reach the 20 % reduction target by 2020. However, most Member States have not yet had sufficient time to take the effects of the EU Climate Change and Energy Package into account for preparing their projections.
- The country breakdown shows a mixed picture towards targets
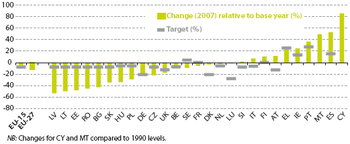
Overall, these figures reflect two distinct trends within the EU. On the one hand there was a modest reduction of greenhouse gas emissions in the EU-15, dominated by significant reductions in Germany (restructuring and fuel switching following unification) and the UK (fuel switching in electricity generation) which were off set by increases of greenhouse gas emissions in other Member States and in some source sectors, such as transport. On the other hand, greenhouse gas emissions in the Member States who joined the EU in 2004 and 2007, with the exception of Cyprus and Malta, decreased considerably between 1990 and 2007. Some of these Member States increased their emissions considerably between 2000 and 2007 but will nonetheless over-achieve their targets under the Kyoto Protocol. Others have been able to stabilize their emissions at their previous low levels.
Indicator relevance
There is wide scientific consensus that emissions of greenhouse gases are responsible for global warming, with potentially dramatic economic, social and environmental consequences at global level.
All Member States have reduction targets under the Kyoto Protocol, with the exception of Cyprus and Malta. Eastern European Member States have individual targets with reduction requirements ranging from 6 % to 8 %. The EU-15 agreed to a collective 8 % reduction of its greenhouse gas emissions by 2008-12, compared with the emissions in the so-called ‘base year’. To meet this EU-15 reduction target, individual targets for each country have been agreed under the so-called EU ‘Burden Sharing Agreement’.
Definition
This indicator shows trends in man-made emissions of the six greenhouse gases regulated by Definition the Kyoto Protocol (the so called ‘Kyoto basket’): carbon dioxide (CO2), methane (CH4), nitrous oxide (N2O), and the so-called F-gases (hydrofluorocarbons, perfluorocarbons and sulphur hexafluoride (SF6). Each gas is weighted by its global warming potential and aggregated to give total greenhouse gas emissions in CO2 equivalents. The indicator presents annual total emissions as a share of the base year emissions. Emissions and sinks related to land use, land use change and forestry are excluded.
Consumption of renewables
From 2000 to 2007, the share of renewable sources in energy consumption in the EU-27 did not grow in line with the target path
Analysis
- Consumption of renewables has grown over the last decade but the share remains far from the target
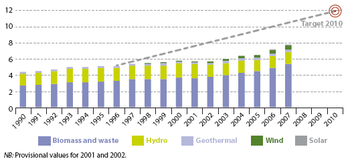
During the 1990s the consumption of renewable energies in the EU-27 increased significantly and has continued to grow between 2000 and 2007. Th is resulted in a share of 7.8 % in 2007 which remains, however, substantially below the 12 % target for 2010. Even if the highest annual change of 8.3 % between 2006 and 2007 continued, the share of renewables would remain below the target.
Biomass is by far the most important renewable energy source, delivering almost 70 % of the total renewable energy in 2007 and having the fastest growing share. Hydro power is second in importance even though both its share and its absolute contribution have diminished between 2000 and 2007 due to a series of several very dry years. Wind and geothermal are still minor contributors and, although their absolute growth rates are increasing rapidly, their shares are only growing slowly.
The proportion of renewables in gross inland energy consumption in 2007 varied widely between Member States. It ranged from 2.1 % in the UK to 29.7 % in Latvia and 30.9 % in Sweden, reflecting differences in resource base, mainly in respect to hydropower capacity and availability of biomass.
Biomass is the predominant renewable source, across all Member States, representing 5.4 % of EU-27 consumption in 2007. It provides 24.6 % of the gross inland energy consumption in Latvia, 19.3 % in Finland and 19.4 % in Sweden. Most of this is wood. In six Member States more than 90 % of renewable energy is derived from biomass. It is also the fastest growing share amongst renewable sources, due to the fact that biomass can be used in all three end-use sectors: power generation, transport and heating.
Second in overall importance is hydropower, which, however, not only decreased its share from 1.8 % to 1.5 % over the period 2000 to 2007 due to several very dry years, but also decreased in absolute terms. Wind and geothermal, whose shares have been growing at a very modest pace, are still relatively minor sources, together representing only 0.8 % of EU-27 energy consumption in 2007. In absolute terms, however, wind power capacity has been growing rapidly. It is now a significant renewable energy source in Spain, Denmark and Germany, where it makes up 22 %, 17 % and 12 % of renewables, respectively. Geothermal, generally another minor source, is the most important renewable energy source in Italy, where it represented 39 % of renewable energy in 2007. Solar energy remains the least important of all renewable energies in terms of its contribution. It represents 0.1 % of EU-27 gross inland energy consumption and 1.2 % of renewables, but its growth in absolute terms is impressive and solar energy constitutes an important renewable energy source in Cyprus and, to a lesser extent, in Greece with shares of 83 % and 10 % of total renewable energy.
Measures aimed at reducing the growth in gross inland energy consumption, for example through energy savings and improving energy efficiency, will also influence the growth rate of this indicator.
Indicator relevance
Renewable energy sources are important for reducing the EU’s dependence on imported fossil fuels and cutting greenhouse gas emissions and other pollutants. In addition, a more mature market for renewable energy technologies is expected to bring about a number of social and economic benefits, including regional and local development opportunities, export opportunities and employment.
Two targets with different time horizons guide the EU effort to expand renewable capacity: the 1997 White Paper’s goal to double the use of renewables in the European Union from 6 to 12 % between 1996 and 2010, and the 20 % renewables target for 2020 established in the recent Directive 2009/28/EC on the promotion of renewable energy. The 2010 target is set as percentage share of renewables in gross inland energy consumption. The 2020 target is defined as share of energy from renewable sources in gross final consumption and will require a different indicator [1].
Unlike the indicative target set for 2010, the 20 % target set for 2020 is binding for all Member States. An effort sharing agreement regulates how much each Member State needs to contribute, with the target depending on the Member State’s current share of renewables, its resource base and its wealth. National targets range from 10 % for Malta up to 49 % for Sweden.
Definition
The indicator is defined as the share of renewables in gross inland energy consumption. It is split into the major energy sources (see methodological notes).
Greenhouse gas emissions by sector
Greenhouse gas emissions decreased in most source categories between 2000 and 2007, but energy industries and transport, the two biggest emitting categories, increased their emissions, thereby offsetting some of the reductions achieved elsewhere
Analysis
- Greenhouse gas emissions from energy industries and transport offset much of the emissions decreases achieved by other sectors
Energy-related emissions represented approximately 80 % – by far the largest share – of total emissions in 2007. The largest emitting source category was the energy industries, which accounted for about 40 % of energy-related emissions, followed by transport, accounting for a further 24 % of energy-related emissions.
Between 2000 and 2007, greenhouse gas emissions produced by energy industries increased by 7.5 % in the EU-27 while energy consumption increased by 8.3 % over the same period. Greenhouse gas emissions from transport, which represented about one-fifth of all EU-27 greenhouse gas emissions in 2007, increased by 7 % in the same period. These two source categories have offset some of the emission decreases achieved elsewhere.
- EU-27 emissions from industrial processes have been growing, but remained about 13 % below the 1990 level in 2006
Greenhouse gas emissions from industrial processes (CO2, nitrous oxide and fluorinated gases) in the EU-27 grew slightly between 2000 and 2007, although the 2007 level was still 9.9 % below that of 1990. Emissions from non-energy-related industrial processes are mainly CO2 from cement production, iron and steel production, nitrous oxide from nitric acid production, and hydrofluorocarbons from refrigeration and air conditioning equipment.
Other sectors saw decreases. Agricultural emissions fell by 5.7 %. Emissions in the manufacturing industry and construction dropped by 3.5 %.
Emissions from international bunkers account for a relatively small but rapidly growing proportion of greenhouse gas emissions. EU-27 GHG emissions from international aviation and maritime transport have increased by 109.7 % and 60.2 %, respectively, between 1990 and 2007.
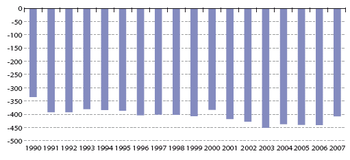
Patterns of land use, land-use change and practices in the forestry sector (LULUCF) can offset emissions, either by removing greenhouse gases from the atmosphere (e.g. by planting trees or improving forest management) or by reducing emissions (e.g. by curbing deforestation). On average 425 million tonnes of CO2 were removed annually between 2000 and 2007 in the EU- 27, which is rather higher than was achieved over the previous decade.
Indicator relevance
Different emission sources related to different sectors of the economy, such as energy production, transport, construction or agriculture, contribute by varying extents to total greenhouse gas emissions. By monitoring trends by sector, the indicator makes it possible to evaluate the effectiveness of measures implemented to cut greenhouse gas emissions. The indicator also highlights those sectors where further action may be needed.
Definition
This indicator shows the contribution of the key source categories to total greenhouse gas emissions, and how they change over time. A key source category is defined as an emission source category that has a significant influence on a country’s greenhouse gas inventory in terms of the absolute level of emissions, the trend in emissions, or both. The different greenhouse gases are weighted by their global warming potential, and the results are expressed in CO2 equivalents.
Greenhouse gas intensity of energy consumption
Between 2000 and 2007 moderate progress was made in reducing the greenhouse gas emissions per unit of energy consumption
Analysis
- The greenhouse gas intensity of energy consumption fell at a slower rate than during the 1990s
In the EU-27, the greenhouse gas intensity of energy consumption decreased by an average annual rate of about 0.6 % between 2000 and 2007, mainly due to the switching from solid fuels to gas and, to a lesser extent, to nuclear energy and renewable energies (see also indicator ‘Gross inland energy consumption’). However, the decrease was not as strong as in the 1990s when the emission intensity of energy consumption decreased by an annual average of 1.1 %.
Indicator relevance
Each type of fossil fuel contains a diff erent amount of carbon for each unit of produced energy; the switch to lower- or low-carbon content fuels is an important measure for achieving a number of objectives of the EU SDS. High carbon-content fuels include lignite and coal, whilst natural gas is a relatively low-carbon fuel. Switching to lower carbon fuels and to renewable sources reduces greenhouse gas emissions even without reducing overall energy consumption.
Definition
The greenhouse gas intensity of energy consumption is the ratio between energy related greenhouse gas emissions (carbon dioxide, methane and nitrous oxide) and gross inland energy consumption.
Global surface average temperature
The global average temperature in 2008 was 0.7 °C higher than a century and a half ago
Analysis
- The global surface average temperature increased by 0.7 °C over the last century
The year 2008 was among the ten warmest on record since systematic instrumental measurements began in around 1850, although slightly cooler than previous years of this century.
According to the World Meteorological Organization statement on the status of the global climate in 2008, ‘since the beginning of the twentieth century, the global average surface temperature has risen by 0.74 °C, although this increase has not been continuous. The linear warming trend over the past 50 years (0.13 °C per decade) is nearly twice that for the past 100 years’. Nevertheless, there are indications that over the past decade the global temperature rise has slowed down [2].
The Intergovernmental Panel of Climate Change (IPCC) consider that ‘there is high agreement and much evidence that with current climate change mitigation policies and related sustainable development practices, global GHG emissions will continue to grow over the next few decades’. According to all of its scenarios, the IPCC projects that the rise in temperature over the 21st century will very likely be larger than the rise over the 20th century [3].
Indicator relevance
According to the IPCC’s Fourth Assessment Report [4], ‘warming of the climate system is unequivocal, as is now evident from observations of increases in global average air and ocean temperatures, widespread melting of snow and ice, and rising global average sea level’. An objective of the EU SDS is to limit the rise in the global surface average temperature to less than 2 °C compared to the pre-industrial level.
The indicator is contextual due to its weak EU policy responsiveness and because it is unable to monitor the precise temperature deviation from the ‘pre-industrial’ era, defined by IPCC as 1750.
Definition
The indicator shows the combined global land and marine surface temperature record from 1850 onwards, in terms of the temperature deviation from the average 1961 to 1990 in degrees Celsius.
Energy dependency
EU-27 energy dependency has risen steeply since 2000 and the level of around 55 % in 2008 is significantly higher than during the 1990s
Analysis
- More than half of EU energy is imported
Energy dependency shows the extent to which an economy relies upon imports in order to meet its energy needs. Despite annual fluctuations, EU-27 dependency on imported energy remained rather constant throughout the 1990s, at a level of around 45 %. Since 2000, however, the level of dependency has grown, exceeding 50 % in 2004 and reaching a level of about 55 % (based on provisional data) in 2008. This represents a degree of dependence 10 percentage points higher than the average of the previous decade.
Apart from the growing demand for energy, the larger share of natural gas which is imported from outside the European Union and declining oil reserves in the North Sea have contributed to this development.
Indicator relevance
With both energy demand and dependency on oil and gas imports growing and supplies becoming scarcer, the risk of supply failure is rising. Securing energy supplies is therefore high on the EU’s agenda. The security of energy supply is an objective of the Sustainable Development Strategy and of the EU Climate and Energy Package and is the focus of the second strategic energy review.
Definition
Energy dependency is calculated as net imports divided by the sum of gross inland energy consumption and maritime bunkers.
Gross inland energy consumption
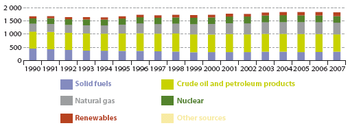
The EU’s energy demand has grown moderately. Between 2000 and 2007 EU-27 energy consumption grew faster than in the previous decade, although since 2003 it has levelled off . There has been a general shift away from solid fuels towards natural gas and to some extent renewable energies
Analysis
- Energy consumption has grown since 2000 but has shown signs of stabilising over recent years. An overall shift away from solid fuels towards natural gas and renewable energies has taken place
Gross inland energy consumption presented an average annual growth of 0.7 % between 2000 and 2007, slightly higher than the rate of 0.4 % in the previous decade. However, since 2003 energy consumption has levelled off . Overall, there has been a shift away from solid fuels, which represented about 27 % of the total consumption in 1990 and only about 18 % in 2007. This shift has been predominantly in favour of natural gas, rising from 18 % to 24 % over the same period, and, to a lesser extent, nuclear energy (rising from 12 % to 13 %) and renewable energies (rising from 4 % to 8 %). The share of crude oil and petroleum products decreased slightly from 38 % in 1990 to 36 % in 2007.
The rise in energy demand of about 80 million tonnes of oil equivalent between 2000 and 2007 mainly involved an increase of about 40 million tonnes of oil equivalent of both natural gas and renewable energies. While solid fuels also increased by about 10 million tonnes of oil equivalent, this was compensated by a decrease in crude oil and petroleum products, and nuclear energy.
Indicator relevance
The burning of fossil fuels (coal, lignite, oil and natural gas) is the largest source of carbon dioxide emissions, and the extraction of coal, oil and gas as well as leaks from gas pipelines are among the main sources of methane emissions. Th erefore, most measures to reduce greenhouse gas emissions in some way target energy consumption and the fuel mix. One such measure is shift ing from solid fuels, which are high-carbon sources of energy, to lower-carbon sources such as natural gas. This, however, has been one of the underlying causes of greater energy dependency in the EU.
Definition
Gross inland energy consumption is the quantity of energy consumed within the borders of a country. It is calculated as total domestic energy production plus energy imports minus energy exports (including fuel supplied to international marine bunkers). The indicator is broken down into the main types of energy sources.
Electricity generation from renewables
The share of renewables in electricity production increased from 13.8 % in 2000 to 15.6 % in 2007 in the EU-27, but remains below the path to the 2010 target of 21 %
Analysis
- Capacity of renewable electricity generation needs to speed up to meet 2010 target
Between 2000 and 2007, the contribution of electricity from biomass, hydro, wind, geothermal and solar energy increased progressively, reaching 15.6 % in 2007. After a decline during the early years of the decade, the annual growth rate is now substantially higher than during the 1990s. Between 2006 and 2007 the share of renewables grew by 1.0 percentage point. However, reaching the 21 % share by 2010 would require almost double of this rate.
Relatively long lead times for power generation investments may partially explain the previous slow progress. Prices for renewable energies, which for some technologies remain higher than conventional power generation, may also contribute to limit the speed of growth. In addition, regulatory barriers, such as difficulties in obtaining planning permission or grid access, persist in many Member States [5].
Indicator relevance
Renewable energy sources produce negligible or zero greenhouse gas emissions. In 2001, the Directive on electricity production from renewable sources established an indicative framework to increase the share of renewables in gross electricity consumption in the EU-15 to 22.1 % by 2010, later modified to 21 % for the EU-27. This target was reaffirmed in the Sustainable Development Strategy as well as in the Renewable Energy Directive.
Definition
The indicator is defined as the share of electricity produced from renewables in gross national electricity consumption.
Consumption of biofuels in transport
Biofuels are a small but rapidly growing energy source for transport. Their consumption has shown accelerated growth since 2000 and reached a share of 2.6 % in 2007 in EU-27. However, despite this growth their share remains below the target path
Analysis
- If growth in biofuels continues, the targets will probably be met
Between 1990 and 2000 the EU-27 share of biofuels in the petrol and diesel consumption of transport increased from zero to 0.24 %. From 2000 to 2007 the growth rate has increased leading to a share of 2.6 % in 2007.
Even though in 2007 the share of biofuels remains well below the target path, the current rate of growth would be sufficient to reach the 5.75 % target by 2010 as well as the binding 10 % target by 2020.
Indicator relevance
Biofuels are a means to curb greenhouse gas emissions from transport and simultaneously reduce the EU dependency on oil imports [6].
A binding target was set for 2020 in the Directive on renewable energy promotion: to reach a 10 % share of renewable fuels in the total fuel consumption of transport, including all renewable energy sources that can be used in transport. The Directive also reconfirms the indicative target for biofuels and other renewable fuels established in the Biofuels Directive of 5.75 % for 2010. In practice, biofuels are expected to contribute all but a tiny proportion of the renewable energy used in transport up to 2010. In order to address concerns about the impact of biofuel production on the environment and in food production, only biofuels conforming to the sustainability criteria laid down in the Directive are taken into account.
Definition
The indicator is defined as the share of biofuels, calculated on the basis of energy content, in the petrol and diesel consumption of transport.
Combined heat and power
The uptake of combined heat and power, or cogeneration, has increased between 2004 and 2007, reaching 10.9 % of gross electricity generation in the EU-27
Analysis
- Combined heat and power generation has increased moderately since 2004
Despite the small decrease in 2006, the share of combined heat and power (CHP) in total EU-27 electricity generation rose by 0.4 percentage points between 2004 and 2007 to 10.9 %. Although a longer time-series for EU-15 is also shown in Fig. 2.16 these data should be treated with caution due to changes in the calculation methodology over time.
According to the Energy Efficiency Action Plan, several barriers prevent expansion of capacity. These include the lack of district heating networks in many areas.
Indicator relevance
Combined heat and power or cogeneration is a technology used to improve energy efficiency through the simultaneous generation of electricity and useful heat. CHP plants exist in various scales ranging from micro CHP employed in single family homes to large-scale facilities. The heat delivered may be used for process or space-heating purposes close to the CHP plant or it can be distributed through district heating networks.
The Directive on the promotion of cogeneration encourages Member States to identify and exploit their potential for ‘high-efficiency cogeneration’ which is defined as cogeneration providing at least 10 % energy savings compared to separate production. More recently, both the Sustainable Development Strategy and the Action Plan on Energy Efficiency have called for increased promotion of CHP.
Definition
This indicator is defined as the share of electricity from combined heat and power (CHP) generation in gross electricity generation.
Implicit tax rate on energy
The implicit tax rate on energy fell by about 4 % between 2000 and 2007. Although this decrease in the effective tax burden on energy is inconsistent with the EU objective to shift taxation from labour onto resource and energy use, there are also indications that taxation may have stimulated energy saving
Analysis
- The implicit tax rate on energy has fallen since 2000
The ratio of energy tax revenues to final energy consumption represents the effective tax burden on energy. The decreases in the implicit tax rate show a decline in the effective tax burden on energy relative to the potentially taxable base. Th is is not consistent with the Sustainable Development Strategy’s principle of shifting taxation from labour onto resource and energy consumption. Nevertheless, there is some evidence that the previously high energy taxation has stimulated improvements in energy effi ciency and has therefore helped to conserve energy. There has also been a greater reliance on policy instruments other than taxes, such as emissions trading. It is also true that energy taxes were reduced to compensate for the substantial rise in the oil price over recent years [7].
Indicator relevance
Many countries use energy taxes as an economic instrument to implement the polluter-pays-principle as well as to support the Kyoto Protocol objectives. The Sustainable Development Strategy recommends that Member States ‘consider further steps to shift taxation from labour to resource and energy consumption and/or pollution, to contribute to the EU goals of increasing employment and reducing negative environmental impacts in a cost-effective way’. Furthermore, the Energy Taxation Directive sets minimum tax rates on energy products and electricity. These levels of taxation do not directly reflect the carbon content of the fuels, but rather the competitive position of the different energy products and electricity.
Definition
The indicator is defined as the ratio between the revenue from energy taxes and final energy consumption, expressed as an index. Prices have been deflated. Implicit tax rates measure the average effective tax burden related to the potentially taxable base.
Data sources and availability
The data presented cover the period from 1990 to 2007/8 (or the latest year available).
Detailed methodological notes on the indicators presented in this article can be found on the sustainable development indicators dedicated section of the Eurostat website.
Greenhouse gas emissions
The methodologies for estimating and reporting greenhouse gas emissions under UNFCCC are described in United Nations Document FCCC/CP/2002/8: Review of the implementation of commitments and of other provisions of the Convention. National communications: Greenhouse gas inventories from Parties included in Annex I to the Convention. UNFCCC guidelines on reporting and review. Note that definitions do not coincide with the NACE nomenclature.
Greenhouse gas emissions by sector
The source categories under UNFCCC are:
- 1. Energy
- 1A Fuel combustion activities
- 1A1 Energy industries
- 1A2 Manufacturing industries and construction
- 1A3 Transport
- 1A4 Other sectors
- 1A5 Other
- 1B Fugitive emissions from fuels
- 1A Fuel combustion activities
- 2. Industrial processes
- 3. Solvent and other product use
- 4. Agriculture
- 5. Land use, land-use change and forestry
- 6. Waste
- 7. Other
Emissions from international aviation and maritime transport (bunkers) are not covered by the Kyoto Protocol and are reported as memo items.
Greenhouse gas intensity of energy consumption
The greenhouse gas emissions included in the calculation are those of source category 1 (Energy), as described above. Emissions due to international aviation and maritime transport are not included. Gross inland energy consumption is described separately below.
Global surface average temperature
The time-series used in this publication is based on the HadCRUT3 dataset, compiled by the Climatic Research Unit, School of Environmental Sciences, University of East Anglia and Hadley Centre for Climate Prediction and Research, UK Meteorological.
Temperature deviations are expressed in terms of the average temperature over the 30-year period from 1961 to 1990. This base period has been chosen because it has the best coverage of measuring stations and can therefore be considered as relatively unbiased.
Annual values are approximately accurate to ±0.05 °C (two standard errors) for the period since 1951. They are about four times as uncertain during the 1850s, with the accuracy improving gradually between 1860 and 1950 except for temporary deteriorations during data-sparse, wartime intervals.
Consumption of renewables
The sources of renewable energy are:
- Hydro: potential and kinetic energy of water converted into electricity in hydroelectric plants;
- Geothermal: energy available as heat emitted from within the Earth’s crust, usually in the form of hot water or steam;
- Wind: kinetic energy of wind exploited for electricity generation in wind turbines;
- Biomass and waste: covers organic, non-fossil material of biological origin which may be used as fuel for heat production or electricity generation. It comprises: charcoal, wood, wood wastes, other solid wastes;
- Solar: solar radiation exploited for hot water production and electricity generation. Passive solar energy for the direct heating, cooling and lighting of dwellings or other buildings is not included.
Energy dependency
Net imports are calculated as total imports minus total exports. Energy dependency may be negative in the case of net exporter countries while positive values over 100 % indicate the accumulation of stocks during the reference year.
Gross inland energy consumption
Gross inland energy consumption represents the quantity of energy necessary to satisfy the inland consumption of the geographical entity under consideration. It is the sum of gross inland consumption of solid fuels, liquid fuels, gas, nuclear energy, renewable energies, and other fuels. The gross inland consumption of an individual energy carrier is calculated by adding primary production and recovered products of energy together with total imports and withdrawals from stocks minus total exports and bunkers. It corresponds to the addition of consumption, distribution losses, transformation losses and statistical differences.
Electricity generation from renewables Renewable energy includes hydroelectricity, biomass, wind, solar, tidal and geothermal energies. Directive 2001/77/ EC defi nes renewable electricity as the share of electricity produced from renewable energy sources in total electricity consumption. The electricity generated from pumping in hydropower plants is included in total electricity consumption but it is not included as a renewable source of energy.
Combined heat and power (CHP)
Note that because the methodology has evolved over time there was no consistent time-series before 2004. CHP statistics depend strongly on the methodology used, since it is technically complicated to separate CHP electricity from the total electricity generated in CHP plants. The methodology, which has a large impact on the statistics has evolved in the course of pilot projects for collecting CHP statistics starting from the early 1990s. According to Directive 2004/8/EC the overall efficiency of a CHP unit is used to determine whether the electricity generation is fully CHP or not. If the overall efficiency is above the efficiency thresholds at levels defined by the Member States, set by the Directive to at least 75 % (80 % for steam condensing extraction turbines and combined cycle units) , all the electricity generated is considered as CHP electricity. On the other hand, if the overall efficiency is below the threshold, the amount of CHP electricity, ECHP is calculated as:
ECHP = C·H
where C is power-to-heat ratio characteristic to the plant and H is CHP heat generation of the plant.
Data for the year 2004 and onwards are collected through the joint Eurostat/IEA/UNECE annual questionnaire for electricity.
Consumption of biofuels in transport
‘Biofuels’ means liquid or gaseous fuel for transport produced from biomass; ‘biomass’ means the biodegradable fraction of products, wastes and residues from agriculture (including vegetal and animal substances), forestry and related industries, as well as the biodegradable fraction of industrial and municipal solid waste [8].
The most important liquid biofuels are bio-ethanol (ethanol produced from biomass and/or biodegradable fraction of waste), bio-diesel (a diesel quality liquid fuel produced from vegetable or animal oil), bio-methanol (methanol produced from biomass), bio-dimethylether (a diesel quality fuel produced from biomass).
Implicit tax rate on energy
Energy taxes include taxes on energy products used for both transport (excluding aviation and maritime transport) and stationary purposes. The most important energy products for transport purposes are petrol and diesel. Energy products for stationary use include fuel oils, natural gas, coal, biomass and electricity. CO2 taxes are included under energy taxes rather than under pollution taxes.
The data include some provisional values for energy taxes in 2004 and final energy consumption in 1998 and 2000-2004. There is a break in the series in 1995.
Context
Sustainable development is a fundamental and overarching objective of the European Union, enshrined in the Treaty. The EU sustainable development strategy, launched by the European Council in Gothenburg in 2001 and renewed in June 2006, aims for the continuous improvement of quality of life for current and future generations.
Background
Although energy policy has always been of central importance to the EU, its focus has shifted and evolved over the past 50 years. Initially the main concerns were the creation of a single market in coal and cooperation in the field of nuclear energy. However, the oil crisis of the 1970s demonstrated the need for coordinated action to stabilise prices and supplies. Since then the issues of energy saving, renewables, harmonisation of taxes on oil products, and the development of a trans-European energy distribution network have been agreed at Community level. Environmental policy has also treated energy-related issues such as pollutant emissions resulting from energy use. The two issues of major current concern, climate change and security of supply, both require action at the international and global level. As a result, the need for a common EU energy strategy has become apparent.
Climate change is one of the greatest challenges for our planet
Climate change is a major preoccupation both for politicians and the general public. There is a wide consensus amongst scientists that increases in the average temperature of the Earth over the last 250 years are largely due to greenhouse gas (GHG) emissions resulting from human activities, in particular the burning of fossil fuels. An increase in the Earth’s average temperature by more than 2 °C above pre-industrial levels could have severe consequences for the environment, the economy and human society itself [9].
The potential impacts of climate change are wide ranging, and include altered weather patterns, changes in agricultural yields, loss of biodiversity and other changes in ecosystems, water and food shortages, floods, heat waves, and novel diseases. All countries of the World are likely to be affected, although to differing degrees, and some of the consequences are already visible. To limit these consequences, it is necessary to make substantial cuts in GHG emissions. Based on the best estimates of the Intergovernmental Panel on Climate Change (IPCC), in order to keep the increase in average temperature below the 2 °C threshold, by 2050 global emission reductions need to be in the range of 50‑85 % of their levels in 2000 [10].
GHG reductions targets are set by the Kyoto Protocol. Negotiations are under way to agree on post-Kyoto framework
The Kyoto Protocol to the United Nations Framework Convention on Climate Change is currently the only international instrument that sets binding reduction targets for GHG emissions. According to the Protocol, over the period 2008 to 2012 the average emissions of the developed countries should have fallen by 5.2 % relative to their 1990 levels. Negotiations are underway to agree on the future regime after this period.
The energy sector faces multiple challenges
In addition to climate change, the EU faces a number of other challenges in its energy sector. Energy production is responsible for other environmental impacts, such as air pollution and consumption of land. Moreover, the environment is not the only concern of the energy sector. As the renewed Sustainable Development Strategy states, energy policy should also be consistent with the objectives of supply security and competitiveness, as illustrated by the energy crisis into which Europe was plunged after supplies of natural gas from Russia were cut in the winter of 2008/09. The EU’s energy objectives include reducing its dependence on energy imports, in particular through improving energy efficiency and increasing the contribution of renewable energies, but also through establishing reliable energy supply partnerships and contracts. In order to move towards a secure and sustainable energy future, the EU intends to transform itself into a low-carbon, less energy-intensive economy.
Major new policy developments in the climate change and energy matter
In the light of the above the Climate and Energy Package aims to cut greenhouse gas emissions and energy consumption and to reduce the EU’s dependence on foreign energy sources. The EU is committed to reducing its GHG emissions by at least 20 % below 1990 levels by 2020, and, if other developed countries commit to comparable efforts, is ready to scale up this reduction to as much as 30 % under a new global climate change agreement. Central to the strategy is a strengthening and expansion of the European Emission Trading System (EU ETS). Emissions from the sectors included in the EU ETS will be cut by 21 % by 2020 compared with 2005 levels, while emissions from sectors not included in the EU ETS – such as transport, housing, agriculture and waste – will be reduced by 10 % from 2005 levels by 2020. Each Member State will contribute to this effort according to its national circumstances, with national legally binding emission targets ranging from -20 % to +20 % [11]. The package also includes mandatory targets to increase the share of renewable energies in energy use to 20 % by 2020, also differentiated according to Member States’ capabilities.The package also promotes the development and safe use of carbon capture and storage technologies, so that CO2 may be captured and stored underground.
Emission cuts for transport will be delivered by legislation aimed at reducing the CO2 emissions from new cars to an average of 120 grams per km, to be phased in between 2012 and 2015, and to further reduce to 95 grams per km by 2020. This measure alone should contribute more than one-third of the emission reductions required in the non-ETS sectors. In addition the Fuel Quality Directive has recently been revised, and will require fuel suppliers to reduce greenhouse gas emissions from the fuel production chain by 6 % by 2020.
Potential linkages
Issues within the climate change and energy theme are closely interrelated, and there are also strong links to other themes.
Consumption of fossil fuels leads to GHGs and energy dependency
The combustion of fossil fuels is a major source of greenhouse gas emissions. At the same time, since the EU does not possess sufficient reserves of fossil fuels to meet its own energy demand, continued reliance on fossil fuels leads to dependence on third country sources, and security of supply issues.
Since producing energy from renewable sources results in negligible greenhouse gas emissions, and since such sources can originate either within the EU or in a wide range of third countries, renewables contribute to the two major objectives of limiting climate change and assuring the security of energy supplies.
Complementary to the diversification of energy sources is the reduction of demand. This can be achieved by promoting energy saving and efficiency on the one hand, for example through the cogeneration of heat and power, and imposing tax on energy consumption on the other hand.
Climate change can also impact on the energy sector. The generation of hydroelectricity is affected by changes in patterns of rainfall. When winters are milder less heating is necessary, and when summers are hotter there is more demand for air-conditioning. Moreover new weather patterns can also be less or more favourable for producing biomass for electricity or biofuels. Melting sea ice could also increase the feasibility of extracting fossil fuels from previously inaccessible reserves.
Linkages with other themes and issues
The White Paper on adaption provides an exhaustive description of the linkages between climate change and other areas. They include designing policies and infrastructure investments, managing waters and forests, preparing for change in crop yield and spread of new diseases. Since energy is used in virtually every economic activity, climate change and energy policies have an impact on a wide range of social, environmental and economic aspects. At the same time, some of the climate change mitigation measures have broader positive impacts such as the improvement of air quality. Reducing emissions through renewable energies and energy saving has not only the potential to cut energy costs but also to create new jobs and increase industrial competitiveness.
Further Eurostat information
Publications
- Sustainable development in the European Union - 2009 monitoring report of the EU sustainable development strategy
- Energy, transport and environment indicators - Pocketbook, 2009
- Panorama of energy: Energy statistics to support EU policies and solutions - Statistical book, 2009
Database
- Indicators
- Climate Change and Energy
Dedicated section
Other information
- Commission communication, Promotion of the use of energy from renewable sources (Renewable Energy Directive), COM(2009) 28
- Commission communication, 20 20 by 2020: Europe’s climate change opportunity, COM(2008) 30
- Commission communication, An energy policy for Europe, COM(2007) 1
- Commission communication Energy efficiency: delivering the 20 % target, COM(2008) 772
- Commission Staff Working Document, The renewable energy progress report, SEC(2009) 503
- Green Paper - A European Strategy for Sustainable, Competitive and Secure Energy, European Commission, COM/2006/0105 final
- White paper - Adapting to climate change : towards a European framework for action, European Commission, COM/2009/0147 final
- Energy and environment report 2008, European Environment Agency, Report No 6/2008
- Greenhouse gas emission trends and projections in Europe 2008: Tracking progress towards Kyoto targets, European Environment Agency, Report No 5/2008
- International Energy Agency, World energy outlook 2009, IEA, Paris, 2009, in press
- Pachauri, R.K and Reisinger, A. (eds.), Climate Change 2007: Synthesis Report. Contribution of Working Groups I, II and III to the Fourth Assessment Report of the Intergovernmental Panel on Climate Change, IPCC, Geneva, 2007
- Rummukainen, M. and Källén, E., New climate science 2006-2009. A brief review of research into the physical science basis of the climate change issue since IPCC AR4/WG I of 2007, The Commission on Sustainable Development, Stockholm, 2009
- Stern, N.H., The economics of climate change: the Stern review, Cambridge University Press, Cambridge, 2007*Directive 2009/28/EC of 23 April 2009 on the promotion of the use of energy from renewable sources(Renewable Energy Directive)
External links
See also
Notes
- ↑ Energy, transport and environment indicators - Pocketbook, 2009
- ↑ Knight, J., Kennedy, J.J., Folland, C., Harris, G., Jones, G.S., Palmer, M., Parker, D., Scaife, A., and Stott, P., ‘Do global temperature trends over the last decade falsify climate predictions?’ [in State of the climate in 2008], Special Supplement to the Bulletin of the American Meteorological Society, 90(8), August 2009, pp. 24-5.
- ↑ Pachauri, R.K and Reisinger, A. (eds.), Climate Change 2007: Synthesis Report. Contribution of Working Groups I, II and III to the Fourth Assessment Report of the Intergovernmental Panel on Climate Change, IPCC, Geneva, 2007, pp.44-5.
- ↑ Solomon, S., Qin, D., Manning, M., Chen, Z., Marquis, M., Averyt, K.B., Tignor, M. and Miller, H.L. (eds), Climate Change 2007: The physical science basis. Contribution of Working Group I to the Fourth Assessment Report of the Intergovernmental Panel on Climate Change, Cambridge University Press, 2007, p.5.
- ↑ Commission communication, Renewable energy road map. Renewable energies in the 21st century: Building a more sustainable future, COM(2006) 848
- ↑ Commission communication, An EU strategy for biofuels, COM(2006) 34.
- ↑ European Commission, Taxation trends in the European Union: Data for the EU Member States and Norway - Statistical bookPublications Office of the European Union, 2009, pp. 123-4.
- ↑ Directive 2003/30/EC on the promotion of the use of biofuels or other renewable fuels for transport.
- ↑ Pachauri, R.K. and Reisinger, A. (eds), Climate change 2007: Synthesis report, IPCC, Geneva, 2007, pp. 48-54.
- ↑ Metz, B., Davidson, O.R., Bosch, P.R., Dave, R. and Meyer, L.A. (eds), Climate Change 2007: Mitigation. Contribution of Working Group III to the Fourth Assessment Report of the Intergovernmental Panel on Climate Change, Cambridge University Press, 2007, pp. 227-9.
- ↑ Decision 406/2009/EC on the effort of Member States to reduce their greenhouse gas emissions to meet the Community’s greenhouse gas emission reduction commitments up to 2020.
