_(percentage_points_difference_between_2011_and_2006,_based_on_%25_of_total_value_added)_RYB14.png)
 (percentage points difference between 2011 and 2006, based on % of total value added) RYB14.png&body=Statistics Explained - T b 10 EU-28 regions, change in the share of agriculture in the economy, gross value added at basic prices, by NUTS 2 regions, 2006–11 (1) (percentage points difference between 2011 and 2006, based on % of total value added) RYB14.png %0A https%3A%2F%2Fec.europa.eu%2Feurostat%2Fstatistics-explained%2Findex.php%3Ftitle%3DFile%3AT_b_10_EU-28_regions%2C_change_in_the_share_of_agriculture_in_the_economy%2C_gross_value_added_at_basic_prices%2C_by_NUTS_2_regions%2C_2006%25E2%2580%259311_%281%29_%28percentage_points_difference_between_2011_and_2006%2C_based_on_%2525_of_total_value_added%29_RYB14.png)
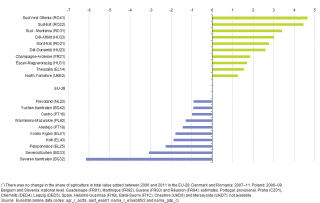
File:T b 10 EU-28 regions, change in the share of agriculture in the economy, gross value added at basic prices, by NUTS 2 regions, 2006–11 (1) (percentage points difference between 2011 and 2006, based on % of total value added) RYB14.png
Revision as of 09:09, 11 June 2014 by EXT-A-Redpath (talk | contribs)
_(percentage_points_difference_between_2011_and_2006,_based_on_%25_of_total_value_added)_RYB14.png)
_(percentage_points_difference_between_2011_and_2006,_based_on_%25_of_total_value_added)_RYB14.png&diff=cur&oldid=185592)
_(percentage_points_difference_between_2011_and_2006,_based_on_%25_of_total_value_added)_RYB14.png&direction=next&oldid=185592)
_(percentage_points_difference_between_2011_and_2006,_based_on_%25_of_total_value_added)_RYB14.png&diff=next&oldid=185592)

Size of this preview: 800 × 508 pixels. Other resolutions: 320 × 203 pixels | 1,005 × 638 pixels.
Original file (1,005 × 638 pixels, file size: 41 KB, MIME type: image/png)
File usage
There are no pages that use this file.
_(percentage_points_difference_between_2011_and_2006,_based_on_%25_of_total_value_added)_RYB14.png&oldid=185592)
_(percentage_points_difference_between_2011_and_2006,_based_on_%25_of_total_value_added)_RYB14.png&action=edit&redlink=1)
_(percentage_points_difference_between_2011_and_2006,_based_on_%25_of_total_value_added)_RYB14.png&action=history)