Archive:European Neighbourhood Policy - South - international trade in goods statistics
- Data from July 2013. Most recent data: Further Eurostat information, Main tables and Database.
This article is part of an online publication and focuses on the structure and the evolution of the international trade in goods of the European Neighbourhood Policy – South (ENP-S) region. It offers an overview of the key characteristics of the international trade patterns in Algeria (DZ), Egypt (EG), Israel (IL), Jordan (JO), Lebanon (LB), Morocco (MA), Palestine (PS), Syria (SY) and Tunisia (TN); data for Libya have not been collected yet. This article presents data on imports and exports, the distribution of exports and imports by groups of goods and the information on the trends of trade between ENP-South countries and the European Union (EU).

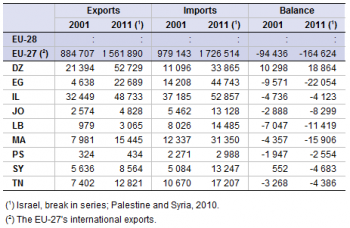
Source: for the EU aggregates, Eurostat (ext_lt_intratrd); for the MED countries, Eurostat (med_ecet)

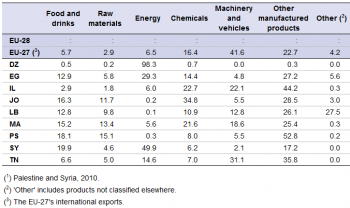
Source: for the EU aggregates, Eurostat (ext_lt_intratrd); for the MED countries, Eurostat (med_ecet)

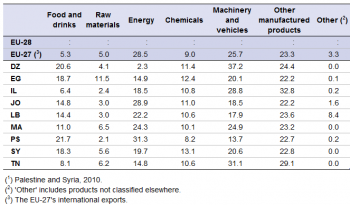
Source: for the EU aggregates, Eurostat (ext_lt_intratrd); for the MED countries, Eurostat (med_ecet)

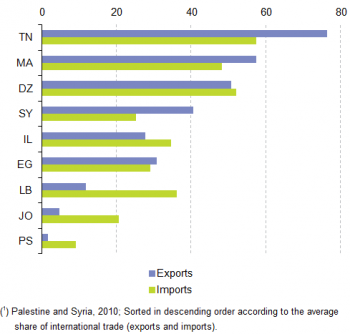
Source: for the MED countries, Eurostat (med_ecet)
Main statistical findings
Trade balance
ENP-South countries face large trade deficits
The economies of the ENP-South countries are highly integrated with the international economy; the average value of trade flows of goods for those countries for which 2010 or 2011 data are available typically corresponded to between 18 % and 45 % of GDP, much higher than the 13.0 % share for the EU-27 in 2011. For the majority of the ENP-South countries — the only exception being Algeria — the import of goods constituted the larger part of these trade flows (see Table 1). This resulted in relatively large trade deficits: – 13.3 % of GDP in Tunisia (2011), – 22.3 % of GDP in Morocco (2011), – 37.0 % of GDP in Lebanon (2010) and – 40.6 % of GDP in Palestine (2010). By way of comparison, the EU-27 trade deficit equated to – 1.3 % of GDP in 2011 (a deficit of EUR 164.6 billion).
Over the period between 2001 and 2011, there was strong growth in both the values of exports and imports of goods among the majority of ENP-South countries (see Table 1), despite widespread contractions in 2009. Particularly strong growth was recorded in Egypt and Lebanon, where the values of exports of goods rose five-fold and three-fold respectively, and where the value of the imports of goods tripled and doubled.The other ENP-South countries also experienced increases although of less spectacular intensity, especially in recent years.
Trade by groups of goods
Make-up of exports is more diverse between ENP-South countries than the make-up of imports
The ENP-South countries differed greatly in the make-up of the goods they exported (see Table 2), although there was much less diversity in the shares of the groups of products imported — see Table 3. Energy commodities accounted for almost all (98.3 %) of the value of Algeria’s exports in 2011 and about one half (49.9 %) of the export value of goods from Syria (2010). Exports of ‘other’ manufactured goods accounted for just over one half (52.8 %) of total exports from Palestine in 2010 and two-fifths (44.2 %) of exports from Israel in 2011. Exports of chemicals also accounted for just over one third of exports from Jordan.
Concerning imports (see Table 3), the ENP-South countries as a group differed from the EU-27 regarding the relative shares of energy commodities and food and drinks in particular. Imports of energy accounted for a lower share of total imports in all the ENP-South countries than was the case for the EU-27 (28.5 %) in 2011, with the exception of Jordan and Palestine. In contrast, food and drinks accounted for a higher share of total imports in all ENP-South countries than was the case for the EU-27 (5.3 %) in 2011.
EU as a trading partner
The EU-27 is a key partner of most of the ENP-South countries in the trade of goods
The EU-27 was a key partner of most of the ENP-South countries in the trade of goods — see Figure 4 — although less so with Jordan and Palestine. Indeed, it accounted for a majority of the total trade in goods with Algeria, Morocco and, in particular, Tunisia. Nevertheless, reliance on the EU-27 as a market for imports and exports of goods declines over the ten years from 2001 to 2011, with the notable exception of Jordan for exports. The EU‑27 was a relatively more important partner for imports of goods than for exports in Algeria, Israel, Lebanon, Jordan and Palestine (2010), and, on the other hand, it was a more important partner for exports from Morocco, Syria (2010) and Tunisia.
Only Algeria and Syria had positive trade balances in goods with the EU-27 over the period between 2001 and 2011, in both cases based on exports of energy commodities. To a large extent, the fluctuations in their respective positive trade balances during this period reflected changes in world energy prices. Trade deficits in goods with the EU-27 were recorded for all other ENP‑South countries, and widened relatively steadily over the reference period in Egypt, Lebanon and Morocco.
Data sources and availability
The data for the ENP are supplied by and under the responsibility of the national statistical authorities of each of the countries or territories on a voluntary basis. Data from other sources are very limited and clearly identified. The data for Algeria, Egypt, Israel, Jordan, Lebanon, Morocco, Palestine, Syria and Tunisia are collected by Eurostat within the framework of the MEDSTAT project. The statistics that are included in this article are freely available on-line and form part of the Pocketbook on Euro-Mediterranean statistics.
Context
Trade statistics are of prime importance for both public (decision makers at an international, EU and national level) and private users, as they provide valuable information on the current trends in the exchange of goods within a specific geographical area. Moreover, they enable the EU to monitor the progress in strengthening trade ties with ENP partners, as it is recognised that “trade in goods and services is a powerful instrument for stimulating economic growth, enhancing competitiveness and supporting economic recovery”.
Moreover, they enable the EU to prepare multilateral and bilateral negotiations on a common trade policy. Furthermore, international trade statistics support European businesses in their market surveys and improve their competitiveness.
The policy context of the European Neighbourhood Policy (ENP) is explained here.
See also
Further Eurostat information
Publications
- Pocketbook on Euro-Mediterranean statistics – 2013 edition
- Pocketbook on Euro-Mediterranean statistics – 2012 edition
- Pocketbook on Euro-Mediterranean statistics – 2011 edition
Database
- Economy and finance (med_ec)
- International trade as a share of gdp (med_ec4)
- International trade by SITC -thousand EUR (med_ecet)