Archive:Enlargement countries - industry and service statistics
- Data from September 2013. Most recent data: Further Eurostat information, Main tables and Database.
This article is part of an online publication based on the ‘Key figures on the enlargement countries – 2014 edition’ pocketbook and provides some characteristics of the industry and services in the enlargement countries and in the European Union (EU). It provides details about the industrial production index, the domestic output price index for industries, construction production and costs indexes, retail trade turnover and the number of bed places in hotels or similar accommodation establishments. It presents data for the enlargement countries and also for the EU aggregates.

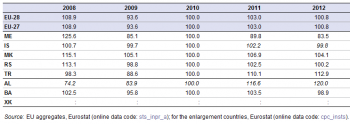
Source:for the EU aggregates, Eurostat (sts_inpr_a), for the enlargement countries (cpc_insts)

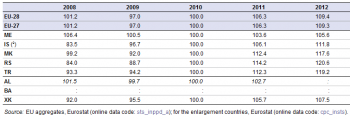
Source:for the EU aggregates, Eurostat (sts_inppd_a), for the enlargement countries (cpc_insts)

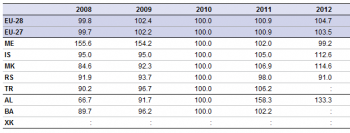
Source:for the EU aggregates, Eurostat (sts_copr_a) and (sts_copi_a), for the enlargement countries (cpc_insts)

Source:for the EU aggregates, Eurostat (sts_trtu_a), for the enlargement countries (cpc_insts)

Source:for the EU aggregates, Eurostat (tour_cap_nat), for the enlargement countries (cpc_intour)
Main statistical findings
Various trends in industrial production among enlargement countries after the economic crisis
In the aftermath of the 2008 global financial crisis, and as a direct consequence, the EU along with most of the enlargement countries reported a general decline in industrial production. Although an increase in production was noted between 2010 and 2011, it was followed by a slowdown in 2012, and, in many cases, industrial production did not reach the pre-crisis levels. In the EU, the industrial production index (excluding construction) in 2012 merely reached the level it had in 2010 (see Table 1). The situation in the enlargement countries was quite diverse; in Serbia, for instance, the industrial production index lost more than 14 index points between 2008 and 2009, and by 2012, the country was not able to reverse the trend: in 2012 the industrial production index reached the level it had in 2010 which was lower than the one before the economic crisis in 2008. In Montenegro, whose production was particularly hard hit by the crisis, the industrial production index of 2012 stood 16.5 % below the country’s 2010 level. Iceland and Bosnia and Herzegovina registered a decline in the industrial production index in 2009, followed by a slight recovery in 2010 and 2011. However, the industrial production decreased in 2012 and was below its 2010 level. In Turkey and Albania, the industrial production increased from 2009 onwards and the industrial production index reached the value of 113 and 120 (estimated) in 2012, respectively. As measured by the domestic output price index for all industries excluding construction, prices in the EU rose by 9.4 % between 2010 and 2012 (see Table 2). Increasing prices during this time span were also recorded among all the enlargement countries for which data are available, and most notably in Turkey and Serbia (around 20 %). Similarly to the industry sector, the construction sector was not spared from the effects of the 2008 crisis either; both in the EU and in the enlargement countries (see Table 3). The construction production index decreased between 2008 and 2010 before showing an upward trend again (with the exception of Albania where the construction production index increased until 2009 and then decreased from 2010 onwards). This was also not the case in the EU which registered a further decrease from 2009 onwards. Between 2010 and 2012, the construction production index showed considerable increases in Montenegro, the former Yugoslav Republic of Macedonia and Serbia; in Turkey, the increase was less prominent. Looking at the construction cost index, increases were only moderate, both for the EU (+5 % between 2010 and 2012) and the enlargement countries for which data are available (between 7 % and 18 %). In Albania, the construction cost remained virtually unchanged. Between 2010 and 2012, the growth of the retail trade turnover in Montenegro and Turkey outstripped that of the EU by a considerable margin (see Table 4): whereas the retail trade turnover in the EU rose by 3.2 %, that of Montenegro and Turkey increased by over 30 %, much in contrast with Serbia and Albania, where a slight decrease compared to 2010 was registered. Nevertheless, an upward trend between 2011 and 2012 was again noted for Serbia and to a lesser extent also for Albania.
Bed capacity in Albania: spectacular growth, but starting off from a low level
One way of measuring the growth of tourism in a country is by counting the beds available in hotels and similar establishments but it should be remembered that bed capacity does not reflect bed occupancy. Such data are, unfortunately, not directly comparable across the EU and among the enlargement countries, mostly as a result of methodology differences (this is especially true for the former Yugoslav Republic of Macedonia). The tourism industry, similarly to the other economic sectors, suffered from the 2008 economic crisis. Between 2009 and 2010, the estimated number of beds in the EU decreased, but by 2012, the loss in capacity was largely compensated again. From among the enlargement countries, Serbia registered a trend towards a further reduction of bed capacity from 2010 onwards. In contrast, Turkey continued to increase its bed capacity: between 2010 and 2011, 6.2 % more beds were available. Iceland and the former Yugoslav Republic of Macedonia have also steadily increased their capacity, whereas in Albania, after years of very strong growth, a certain consolidation appeared to be taking place in 2012.
Data sources and availability
Data for a core set of indicators are collected each year through questionnaires sent out by Eurostat to the partner countries. A network of contacts in each country has been established for updating the questionnaires. Eurostat distributes the electronic questionnaires to a single contact point in each partner country. This contact point is in charge of the onward distribution of the questionnaires to the various thematic co-ordinators in each country's statistical system (generally within the national Statistical Offices) and of their collection afterwards. When completed, the validated and updated questionnaires are sent back to Eurostat.
Context
Statistics on industry, construction, retail trade and other services allow describing the most recent developments of the European and enlargement countries’ economies. These statistics are important tools for formulating and monitoring the economic and monetary policy of the European Union and of the enlargement countries. They are in great demand by the European Commission and European Central Bank (ECB), national governments and central banks, companies and financial markets.
See also
- International statistical cooperation (online publication)
- Enlargement countries - statistical overview (online publication)
- Short-term business statistics (online publication)
Further Eurostat information
Publications
- Pocketbook
- Key figures on the enlargement countries - 2014 edition
- Key figures on the enlargement countries - 2013 edition
- Leaflets
- Enlargement countries - Economic developments - 2013 edition
- Enlargement countries - International trade - 2013 edition
Database
- Economy and finance (cpc_ec)
- Industry (sts_ind)
- Production in industry (sts_ind_prod)
- Producer prices in industry (sts_ind_pric)
- Construction, building and civil engineering (sts_cons)
- Production in construction (sts_cons_pro)
- Construction cost (or producer prices), new residential buildings (sts_cons_pri)
- Trade and services (sts_ts)
- Wholesale and retail trade (NACE G) (sts_wrt)
- Tourism (tour), see:
- Annual data on tourism industries (tour_inda)
- Capacity of tourist accommodation establishments (tour_cap)