Archive:European Neighbourhood Policy - East - statistics on trade in goods with the EU
- Data from September 2012. Most recent data: Further Eurostat information, Main tables and Database.
This article is part of an Neighbourhood Policy countries - statistical overview online publication and focuses on the international trade in the European Neighbourhood Policy - East (ENP-E) countries, i.e. Armenia (AM), Azerbaijan (AZ), Belarus (BY), Georgia (GE), Moldova (MD) and Ukraine (UA). It provides detailed information on the main indicators of international trade (total exports/imports), the relationship of the ENP-East countries with the European Union (EU) as an economical partner and the main types of goods exchanged.
Source: for the EU-28 and the EU-27, Eurostat (ext_lt_intratrd); for the ENP-East countries, Eurostat (enpr_etmain)
Source: for the EU-28 and the EU-27, Eurostat (ext_lt_intratrd) and (nama_gdp_c); for the ENP-East countries, Eurostat (enpr_ecnagdp)
Source: Eurostat (enpr_etflow)
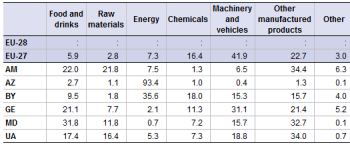
Source: for the EU-28 and the EU-27, Eurostat (ext_lt_intratrd); for the ENP-East countries, Eurostat (enpr_etsitc)
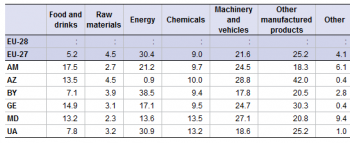
Source: for the EU-28 and the EU-27, Eurostat (ext_lt_intratrd); for the ENP-East countries, Eurostat (enpr_etsitc)
Main statistical findings
Trade balance
Azerbaijan: the unique ENP-East country with a positive trade balance
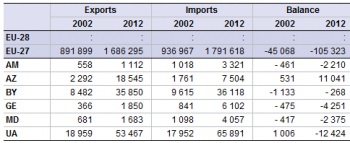
When comparing 2012 to 2002, all ENP-East countries observed a significant growth in the total amounts of both exports and imports (see Table 1). The most noticeable figure was registered in Azerbaijan where the total amount of exports increased eight-fold during the decade. This huge increase, which started in 2008, can be explained by the oil trade situation with the opening of the Baku-Tbilisi-Ceyhan pipeline connecting the Caspian Sea to the Mediterranean Sea.
In all other ENP-East countries except Belarus, the amount of imports increased faster than that of exports during between the same years.
For the same reason as explained above (oil trade), Azerbaijan recorded an impressive EUR 11 billion positive trade balance in 2012, making this country a unique case among the ENP-East countries. Indeed, the other five countries recorded trade deficits in 2012 ranging from EUR 268 million in Belarus to EUR 12.4 billion in Ukraine (in 2002, Ukraine had a positive trade balance of EUR 1 billion).
Total exports and imports
Exports and imports as an important share of GDP
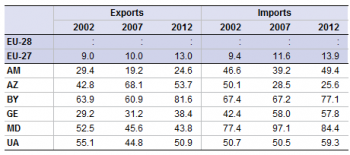
When comparing the amounts of exports and imports with the gross domestic product (GDP), figures are relatively different between all ENP-East countries (see Table 2). Nevertheless, one characteristic is common to all of them: their share of both exports and imports expressed in percentage of GDP were much higher than the EU average all along the period between 2002 and 2012.
In 2012, both the shares of exports and imports relative to the GDPwere higher than 25 % in all ENP-East countries. In Moldova, imports even accounted for 84.4 % of the GDP.
The EU as a main trading partner of the ENP-East countries
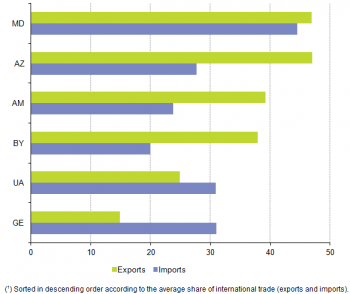
The EU is a key partner of the ENP-East countries in terms of trade of goods and service (see Figure 3). Indeed, the EU was a favourite counterpart for exports in Azerbaijan in 2012 (47 % of its total exports) and, to a slightly lesser extent, also in Moldova (46.8 %), Armenia (39 %) and Belarus (37 %). As regards the share of imports from the EU, Moldova took the lead in 2012 among ENP-East countries (44 % of its total imports), whilst Georgia and Ukraine ranked second (31 %), closely followed by Azerbaijan (28 %).
When looking deeper at the value of the trade in goods between the EU and ENP-East countries, Ukraine was by far the biggest importer of goods and services from the EU in 2012 (EUR 20.4 billion), in line with the tendency recorded since 2002 (see Table 4).
In 2012, Belarus has gained the leadership in the value of exports (EUR 13.6 billion in 2012) and overpassed Ukraine (EUR 13.3 billion) in terms of the value of exports. Azerbaijan came third with a total value of exports that amounted to EUR 8.7 billion.
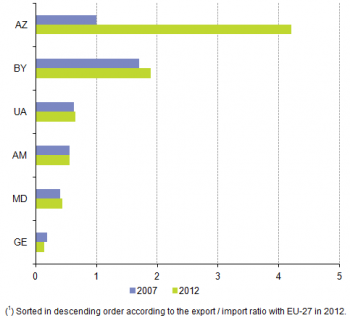
Belarus and Azerbaijan are the two ENP-East countries recording a positive trade balance with the EU in 2012 (EUR 6.4 and 6.6 billion respectively), far above the steadily increasing trade deficits of Ukraine with the EU (over EUR 7.1 billion in 2012). When turning the trade values into an export/import ratio, the values of the exports of Azerbaijan to the EU were four times higher than those of the imports from the EU in 2012, a significantly higher ratio compared with 2007. In the other ENP-East countries (except Belarus), the situation did not change much during the same five-year period.
Different offers and different needs among ENP-East countries
The ENP-East countries differed in the make-up of the goods they exchange with the world (see Table 6), This was especially the case for the goods they export: whereas Azerbaijan and Belarus profited from their mineral resources exporting energy products (93.4 % and 35.6 % of their total exports in 2012, respectively); Armenia, Moldova and Ukraine concentrated their exports mainly on other manufactured products (between 32.7 % and 34.9 % during the same reference year) while 42 % of EU exports concerned the machinery and vehicle industry.
As regards the imports by types of goods (see Table 7), the ENP-East countries can be roughly divided into three groups. The first group comprises the high energy importing countries and includes Belarus (38.5 % of total imports in 2012) and Ukraine (30.9 %). The other main products these countries also imported concerned machinery, vehicles and other manufactured products. Actually, this group appears to have the same trade profile as the EU, where the imports of energy products also outstripped the other two above mentioned categories.
The second group also depends on the same three types of goods but with lower imports of energy and higher imports of machinery and manufactured products. It concerns Armenia, Georgia and Moldova, where the aggregated share of the three types of commodities accounted for about two thirds of the total imports of each country. Also important for this group of countries was the share of imported food and drink products (between 13.2 % and 14.9 %).
The last distinguishable group concerns only one country, Azerbaijan, which is absolutely energy independent. Therefore, about 42 % of the products Azerbaijan imported in 2012 were ‘other manufactured products’. When adding them to the 28.8 % of machinery and vehicles, and to the 13.5 % of food and drink products, the share of these three categories of products together reached more than 84 % of the total Azerbaijani imports in 2012.
Data sources and availability
The data for the ENP-East countries are supplied by and under the responsibility of the national statistical authorities of each of the countries or territories on a voluntary basis. Data from other sources are very limited and clearly identified. The data for Armenia, Azerbaijan, Belarus, Georgia, Moldova and Ukraine are taken from the key indicators that are collected on a regular basis by Eurostat. The statistics that are included in this article are freely available on-line.
Context
Trade statistics are of prime importance for both public (decision makers at international, EU and national level) and private users, as they provide valuable information on the current trends in the exchange of goods within a specific geographical area. Moreover, they enable the EU to monitor the progress in strengthening trade ties with ENP partners, as it is recognised that “trade in goods and services is a powerful instrument for stimulating economic growth, enhancing competitiveness and supporting economic recovery” [1].
Moreover, they enable the EU to prepare multilateral and bilateral negotiations on a common trade policy. Furthermore, international trade statistics support European businesses in their market surveys and improve their competitiveness.
The policy context of the European Neighbourhood Policy (ENP) is explained statistical cooperation - European Neighbourhood Policy here.
Further Eurostat information
Publications
Database
- International Trade (enpr_et)
- ENP countries: international trade - main indicators (enpr_etmain)
- ENP countries: Trading partners - flows (enpr_etflow)
- ENP countries: Trade by commodity (SITC) (enpr_etsitc)
- International trade long-term indicators (ext_lti)
- International trade (ext_lti_int)
- International trade of EU, the euro area and the Member States by SITC product group (ext_lt_intertrd)
- EU trade by Member State, by partner and by product group (ext_lti_ext)
- Intra and Extra-EU trade by Member State and by product group (ext_lt_intratrd)
- International trade (ext_lti_int)
- GDP and main components (nama_gdp)
- GDP and main components - Current prices (nama_gdp_c)
Dedicated section
External links
See also
Notes
- ↑ Joint Communication by the High Representative of The Union For Foreign Affairs And Security Policy and the European Commission to the European parliament, the Council, the European economic and social committee and the Committee of the regions, “A new response to a changing Neighbourhood” 25/05/2011, COM(2011) 303, Brussels.

