Archive:Regional labour market disparities
- Data from November 2012 and March 2008, most recent data: Further Eurostat information, Main tables and Database.
This article explores the regional differences in labour market performance in the European Union (EU), highlighting the EU's best-performing and most underperforming regions. The data on the dispersion of unemployment rates in NUTS 2 regions are from November 2012. The employment dispersion rate and data on underperforming regions are calculated for the period 2002 - 2006 and will be updated in July 2013.
Main statistical findings
Disparities in regional unemployment increase in most Member States in 2011
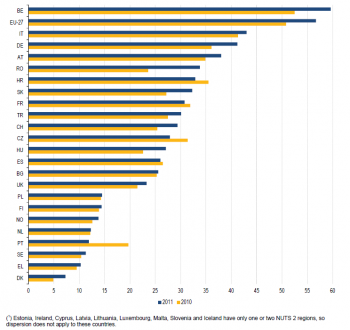
In 2011, the dispersion of regional unemployment rates increased in most Member States compared with the previous year. Figure 1 presents the dispersion of regional unemployment rates in 2011 and 2010. For the EU- 27, the dispersion of unemployment rates increased from 50.8 % in 2010 to 56.7 % in 2011. This overall development was reflected at national level, where disparities in regional unemployment rates rose in most Member States. Decreasing regional disparities were observed in the Czech Republic, Spain, France and Portugal, where dispersion declined from 2010 to 2011.
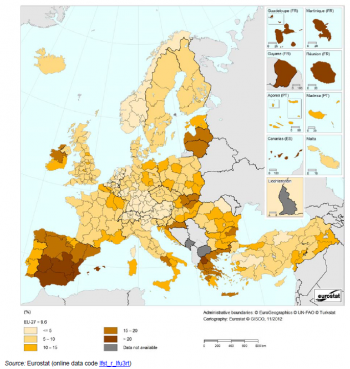
The highest dispersion of unemployment rates was recorded in Belgium (59.6 %), followed by Italy (43.0 %) and Germany (42.3 %). The geographic pattern of the disparities in these countries can also be seen in Map 1. In contrast, Denmark (7.3 %), Greece (10.3 %) and Sweden (11.3 %) had the lowest disparities in regional unemployment rates in 2011. However, low dispersion should not be interpreted as a positive sign for labour markets per se. In the case of Greece, which has quite small regional disparities in unemployment rates, all NUTS 2 regions recorded high unemployment rates over 14 % in 2011. This shows that dispersion only indicates the disparities between regions and not the overall level of unemployment.
Dispersion of regional unemployment rates at NUTS level 3
In 2006, regions with high unemployment were mainly located in north-eastern Europe: in Poland, eastern Germany and eastern Slovakia (Map 2). The French overseas departments, Extremadura in Spain and Italy's southern regions also suffered from high unemployment rates. Map 2 shows some variability in unemployment rates within EU countries: some Member States have different levels of regional unemployment, while others show a quite similar distribution of their regional unemployment rates.
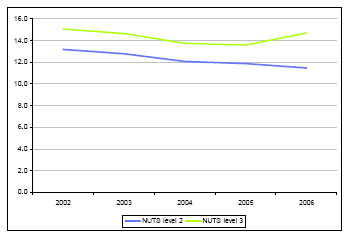
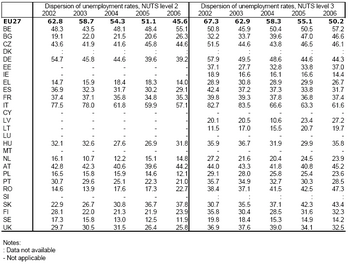
In 2006, the dispersion of regional unemployment rates at NUTS level 3 was slightly higher at 50.2%. These estimates show that the distribution of regional unemployment rates shrunk over 2002 - 2006, with drops of more than 17 percentage points, for both NUTS level 2 and 3.
Dispersion of employment rates
Similar results were seen for employment rates but with a lower magnitude. The dispersion of employment rates at NUTS level 2 decreased in 2002 - 2006 by 1.7 percentage points and stood at 11.4 % in 2006. At NUTS level 3, the dispersion was slightly higher, at 14.7%, only 0.3 percentage points below the level five years ago.
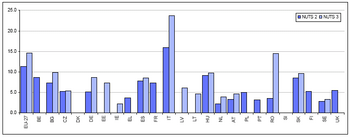
Bulgaria and Romania had dispersions that were not too high compared to the other EU countries at NUTS level 2, but a different picture is revealed at NUTS level 3. These marked differences between the NUTS level 2 and NUTS level 3 dispersions mean that there is a large variability between NUTS level 3 regions belonging to one NUTS level 2 region. For example, the NUTS level 2 Bulgarian region of Yugoiztochen, with an unemployment rate of 8.1 %, comprises NUTS level 3 regions with rates ranging from 4.5 % in Stara Zagora to 17.1 % in Sliven.
The dispersion of employment rates affects countries in a similar manner to the dispersion of unemployment rates, as the countries with high dispersions of unemployment tend to have high dispersions of employment.
There are three exceptions: Austria, Germany and the Czech Republic. These countries have a relatively high dispersion of unemployment but, at the same time, a relatively low dispersion of employment. While in Austria this seems to be related to the low unemployment level, in Germany and the Czech Republic, differences in regional unemployment affect these countries more intensively than differences in employment.
Over the period 2002 - 2006, the Czech Republic, Spain, Poland, Finland, the United Kingdom, Ireland and Sweden have shown a clear decreasing trend in their dispersion of employment rates, at both level 2 and 3 of NUTS. On the other hand, Belgium and Slovakia, increased their dispersion over this period of time.
Four countries have shown different evolutions of their dispersion of employment rates, depending on the NUTS level. Italy, Germany and Portugal have narrowed the distributions of their regional employment rates if NUTS level 2 is considered. But, while this NUTS level 2 is converging to the same level of employment, “sub-NUTS level 2” regions are diverging at the same time. Greece has shown the opposite, since its employment rates at NUTS level 3 are converging within its NUTS level 2 regions, but at NUTS level 2, there has been no convergence.
Underperforming regions
A region is deemed “underperforming” if its employment rate is relatively low compared to the national employment rate (below 90 % of the national figure) or if its unemployment rate is relatively high compared to the national rate (above 150 % of the national figure).
This indicator can also be computed relative to the EU average, drawing attention to regions having trouble absorbing people into their labour markets.
In 2006, at NUTS level 2, there were 51 underperforming regions (UPRs) as regards employment out of 255 regions where data was available. These regions, where employment rates are relatively low compared to the EU average, were home to 20.6 % of the working population aged 15 to 64. Regarding unemployment, at NUTS level 2, there were 43 UPRs out of 261 where data was available, and 16.4% of the active population was living in those regions.
Over the period 2002 - 2006, the UPR index has stayed more or less the same: a decrease of 1 region, from 52 UPRs in 2002, regarding employment and a decrease of 3 regions, from 46 UPRs in 2002, regarding unemployment. This small reduction also led to a marginal decrease n in the population affected by underperformance: there was 0.2 percentage points of working population less living in UPRs as regards employment.
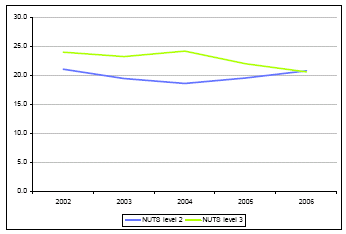
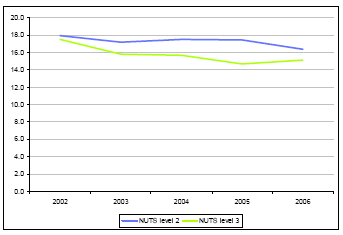
Regarding unemployment, the decrease in active population living in underperforming regions was 1.5 percentage points at NUTS level 2 (Figures 5 and 6). At NUTS level 2, 10 countries in 2006 had UPRs as regards unemployment (Figure 7) and eight countries had none. The underperforming region indicator cannot be computed for eight countries, since these countries comprise just one or two regions. Data for Denmark is still not available in the new NUTS code version.
Population can be affected to a greater or lesser extent, depending on the region considered to be underperforming. While in Spain, Greece and France, the active population affected is 2.5 % or less, in Austria, Belgium, the Czech Republic and Italy, this percentage exceeds 20 %. Italy, with 27.5 %, recorded the highest percentage. This is due to a clear division between the northern and southern Italian regions. The northern regions have lower unemployment rates, ranging from 3.0 % in Piemonte to 7.5 % in Lazio, while rates in the southern regions are significantly higher, ranging from 10.0 % in Molise to 13.5 % in Sicilia.
Regional differences in employment rates
Different results were reported in employment as well. Only eight countries had underperforming regions in 2006 (Figure 8). Italy and Belgium had a significant percentage of people living in regions with relatively low levels of employment. So the underperformance of these countries is seen in both employment and unemployment.
But Austria, with a significant percentage of active population living in underperforming regions, didn’t underperform in employment: it had no underperforming regions at all as regards that criterion. Hungary was the opposite. It did not underperform in unemployment, meaning that there were no regions with a relatively high unemployment rate compared to the other Hungarian regions, but 2 regions, Észak-Magyarország and Észak-Alföld, comprising 27.4 % of the working population, had employment rates that were relatively low.
Data sources and availability
The primary source of regional labour market information is the EU Labour force survey. This survey is a quarterly household sample survey conducted in all EU member States.
The LFS target population is made up of all people in private households aged 15 and over. The survey's definitions are based on the definitions and recommendations of the International Labour Organization. In addition, harmonization is achieved through the Member States’ adherence to common principles of questionnaire design.
Population covers people aged 15 and over, living in private households (population living in collective households, i.e. residential homes, boarding houses, hospitals, religious institutions, workers’ hostels, etc., are not included). This comprises all people living in the households surveyed during the reference week. The definition also includes people absent from the households for short periods (but having retained a link with the private household in question) owing to studies, holidays, illness, business trips, etc. People on obligatory military service are not included.
An employed person is a person aged 15 and over (16 and over in ES and UK, 15 to 74 in DK, EE, HU, LV, SE and FI) who, during the reference week, worked at least one hour for pay or profit, or was temporarily absent from such work. Family workers are included.
The unemployed are people aged 15-74 (16 to 74 in ES and UK) who were (all three conditions must be fulfilled simultaneously):
- without work during the reference week;
- available for work at the time (i.e. were available for paid employment or self-employment before the end of the two weeks following the reference week);
- actively seeking work (i.e. had taken specific steps in the four-week period ending with the reference week to seek paid employment or selfemployment), or who found a job to start within a period of at most three months.
The economically active population (also labelled active population) comprises employed and unemployed people. The employment rate means the proportion of employed people as a percentage of the population.
The unemployment rate shows the proportion of unemployed people as a percentage of the economically active population.
The dispersion of the unemployment rates is expressed by the coefficient of variation of regional unemployment rates.
The coefficient of variation is the ratio between the weighted standard deviation of the regional unemployment rates (NUTS level 2 or 3), compared to the national unemployment rate, and the national unemployment rate. For the EU, the regional unemployment rates are compared with the Union's unemployment rates. This coefficient of variation is multiplied by 100 for expression as a percentage.
This indicator measures the spread of regional unemployment rates as regards the national or EU unemployment rate. If all the regional unemployment rates of a country are equal, the dispersion is zero. Big differences between regional unemployment rates within a country imply a fairly wide dispersion of unemployment rates.
An underperforming region is a region that has a relatively low employment rate or a relatively high unemployment rate. The thresholds considered are below 90 % of the national employment rate and above 150 % of the national unemployment rate. To compute the EU aggregate, the thresholds are below 90 % of the EU employment rate and above 150 % of the EU unemployment rate.
All regional results concern NUTS level 2 and NUTS level 3 regions. Down to NUTS level 2, the regional labour market data provided by Eurostat are derived from the LFS. Down to NUTS level 3, LFS data when available or registered employment and unemployment data when LFS is not available are used to break down the NUTS level 2 figures into NUTS level 3, which are used to compute the regional disparity indicators.
Since the 1st quarter of 2004, the samples for the Austrian, Italian and Maltese Labour Force Surveys have been spread over all weeks of the quarter. At the same time, the sampling and weighting procedures in Greece have been revised in order to improve coverage. The 2003 data for Cyprus refer to the 2nd quarter, while the 2004 data represent annual averages. Consequently, 2004 and 2003 data are not fully comparable for these countries.
Context
Employment and unemployment levels are important indicators of both economic and social health. Countries with high levels of employment - and low levels of unemployment - tend to be performing well economically. In addition, employment is an important determiner of individual well-being, self-esteem and social harmony and equity. Dispersion measures the spread of regional rates within the same country or in the case of the EU-27 across all regions. An increase in dispersion indicates larger disparities, while smaller dispersion shows better cohesion between regions.
Further Eurostat information
Publications
- European Regional and Urban Statistics - Reference guide 2008 (available in English, French and German)
Main tables
- Regions and cities, see:
- Regional statistics
- Data
- Main tables
- Regional statistics (t_reg)
- Regional labour market statistics (t_reg_lmk)
- Employment rate of the age group 15-64, by NUTS 2 regions (tgs00007)
- Unemployment rate, by NUTS 2 regions (tgs00010)
- Dispersion of regional employment rates by gender (tsisc050)
- Share of long-term unemployment (12 months and more), by NUTS 2 regions (tgs00053)
- Employment rate of the group 55-64 years, by NUTS 2 regions (tgs00054)
- Regional labour market statistics (t_reg_lmk)
- Regional statistics (t_reg)
- Main tables
- Data
Database
- Regions and cities, see:
- Regional statistics
- Data
- Database
- Regional statistics (reg)
- Regional labour market statistics (reg_lmk)
- Regional economically active population - LFS series and LFS adjusted series (reg_lfpop)
- Regional employment - LFS series (reg_lfemp)
- Regional unemployment - LFS adjusted series (reg_lfu)
- Regional socio-demographic labour force statistics - LFS series (reg_lfsd)
- Regional labour market disparities - LFS series and LFS adjusted series (reg_lmd)
- Regional labour market data based on pre-2003 methodology (data up to 2001) - LFS adjusted series (reg_lfh)
- Regional labour market statistics (reg_lmk)
- Regional statistics (reg)
- Database
- Data
