,_2005-2007,_EU-27_and_change_between_the_average_yearly_(1995-1997)_and_(2005-2007)_inputs_expenditures_(%25),_EU-27.png)
, 2005-2007, EU-27 and change between the average yearly (1995-1997) and (2005-2007) inputs expenditures (%), EU-27.png&body=Statistics Explained - Average yearly inputs expenditures (EURha), 2005-2007, EU-27 and change between the average yearly (1995-1997) and (2005-2007) inputs expenditures (%), EU-27.png %0A https%3A%2F%2Fec.europa.eu%2Feurostat%2Fstatistics-explained%2Findex.php%3Ftitle%3DFile%3AAverage_yearly_inputs_expenditures_%28EURha%29%2C_2005-2007%2C_EU-27_and_change_between_the_average_yearly_%281995-1997%29_and_%282005-2007%29_inputs_expenditures_%28%2525%29%2C_EU-27.png)
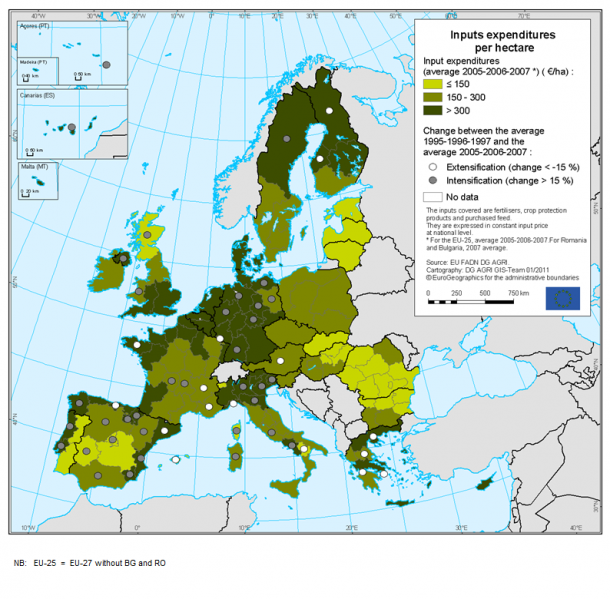
File:Average yearly inputs expenditures (EURha), 2005-2007, EU-27 and change between the average yearly (1995-1997) and (2005-2007) inputs expenditures (%), EU-27.png
,_2005-2007,_EU-27_and_change_between_the_average_yearly_(1995-1997)_and_(2005-2007)_inputs_expenditures_(%25),_EU-27.png)
,_2005-2007,_EU-27_and_change_between_the_average_yearly_(1995-1997)_and_(2005-2007)_inputs_expenditures_(%25),_EU-27.png&diff=cur&oldid=114127)
,_2005-2007,_EU-27_and_change_between_the_average_yearly_(1995-1997)_and_(2005-2007)_inputs_expenditures_(%25),_EU-27.png&direction=next&oldid=114127)
,_2005-2007,_EU-27_and_change_between_the_average_yearly_(1995-1997)_and_(2005-2007)_inputs_expenditures_(%25),_EU-27.png&diff=next&oldid=114127)

Size of this preview: 610 × 599 pixels. Other resolutions: 244 × 240 pixels | 794 × 780 pixels.
Original file (794 × 780 pixels, file size: 336 KB, MIME type: image/png)
File usage
There are no pages that use this file.
,_2005-2007,_EU-27_and_change_between_the_average_yearly_(1995-1997)_and_(2005-2007)_inputs_expenditures_(%25),_EU-27.png&oldid=114127)
,_2005-2007,_EU-27_and_change_between_the_average_yearly_(1995-1997)_and_(2005-2007)_inputs_expenditures_(%25),_EU-27.png&action=edit&redlink=1)
,_2005-2007,_EU-27_and_change_between_the_average_yearly_(1995-1997)_and_(2005-2007)_inputs_expenditures_(%25),_EU-27.png&action=history)