Archive:Architectural, engineering, technical testing and analysis services statistics - NACE Rev. 2
- Data from April 2012. Most recent data: Further Eurostat information, Main tables and Database.
This article presents an overview of statistics for the architectural, engineering, technical testing and analysis services sector in the European Union (EU), as covered by NACE Rev. 2 Division 71; hereafter referred to as architectural and technical services.


(% share of sectoral total) - Source: Eurostat (sbs_na_1a_se_r2)


Main statistical findings
Structural profile
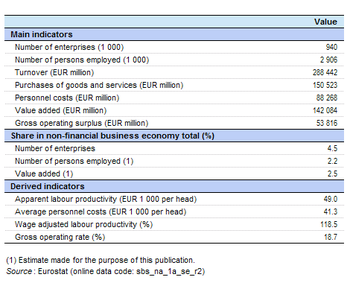
The EU-27’s architectural and technical services (Division 71) sector comprised 940 thousand enterprises in 2009, employed 2.9 million persons and recorded value added of EUR 142 084 million. Within the non-financial business economy (Sections B to J and L to N and Division 95) this sector represented 2.2 % of the total number of persons employed and 2.5 % of value added. Based on value added and employment measures, the architectural and technical services sector was the second largest among the seven NACE divisions within professional, scientific and technical activities (Section M), smaller only than legal and accounting services (Division 69). Architectural and technical services employed 26.5 % of the professional, scientific and technical activities workforce and accounted for 27.3 % of its value added.
Apparent labour productivity within the EU-27's architectural and technical services sector in 2009 was EUR 49 thousand per person employed, above the non-financial business economy average of EUR 41.6 thousand per person employed and slightly above the professional, scientific and technical activities average of EUR 47 thousand per person employed. Equally, at EUR 41.3 thousand per employee, average personnel costs within the EU-27’s architectural and technical services sector were much higher than the non-financial business economy average (EUR 30.0 thousand per employee) and just above the professional, scientific and technical activities average (EUR 40.5 thousand per employee).
The wage-adjusted labour productivity ratio combines the two previous indicators and shows the extent to which value added per person employed covers average personnel costs per employee. As the architectural and technical services sector’s apparent labour productivity and average personnel costs were broadly similar to those for all professional, scientific and technical activities in 2009 it is unsurprising that the wage-adjusted labour productivity ratios were also similar: 118.5 % for the EU-27’s architectural and technical services sector compared with 117.0 % for all professional, scientific and technical activities, well below the wage-adjusted labour productivity ratio for the whole of the non-financial business economy (138.8 %).
The gross operating surplus for the EU-27’s architectural and technical services sector was equivalent to 18.7 % of turnover, which was a slightly higher gross operating rate than the professional, scientific and technical activities average (17.8 %) and close to double the non-financial business economy average (9.7 %).
Sectoral analysis
The EU-27’s architectural and engineering activities (Group 71.1) subsector dominated the architectural and technical services sector and was approximately 6.5 times as large as the technical testing and analysis (Group 71.2) subsector in 2009 in value added and employment terms – see Figure 1.
In terms of productivity and labour cost the two subsectors were very similar. The EU-27’s architectural and engineering activities subsector recorded apparent labour productivity of EUR 49 thousand per person employed in 2009 which was EUR 1 thousand per person more than for the smaller technical testing and analysis subsector. In terms of average personnel costs, the EUR 41.4 thousand per employee for architectural and engineering activities was just EUR 700 per employee more than the average recorded for technical testing and analysis. This closeness resulted in nearly identical wage-adjusted labour productivity ratios: 118.4 % for architectural and engineering activities and 118.6 % for technical testing and analysis.
One indicator where the two subsectors did show a notable difference was the gross operating rate. The EU-27’s architectural and engineering activities subsector produced more than 90 % of the sector’s gross operating surplus and this high share translated into a higher gross operating rate (19.2 %) than for technical testing and analysis (14.3 %). For technical testing and analysis, the gross operating rate was below the professional, scientific and technical activities average (17.8 %) but above the non-financial business economy average (9.7 %).
Country analysis
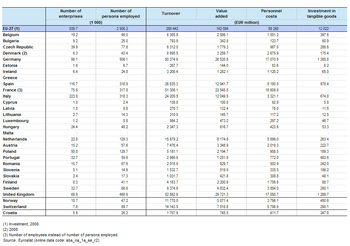
The United Kingdom contributed just over one fifth (20.9 %) of EU-27 value added in the architectural and technical services sector in 2009. Indeed, the architectural and technical services sector accounted for a higher share (3.4 %) of non-financial business economy value added in the United Kingdom than in any other Member State. The United Kingdom’s leading position for this sector was also reflected at a more detailed level for the architectural and engineering activities subsector, whereas Germany had the highest level of value added for technical testing and analysis, while Latvia was the most specialised. As well as the United Kingdom, Slovenia, Sweden and Luxembourg were all relatively highly specialised, as the architectural and technical services sector’s contribution to non-financial business economy value added was 3.2 % in all four of these Member States in 2009; Croatia (3.3 %), Switzerland (3.3 %) and Norway (3.1 %) were also relatively specialised in architectural and technical services.
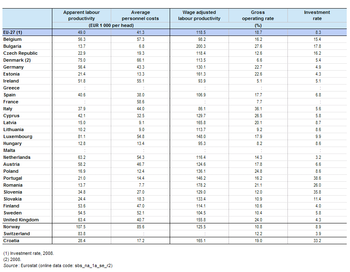
Four Member States recorded wage-adjusted labour productivity ratios below 100 % in the architectural and technical services sector in 2009, namely Belgium, Hungary, Ireland and Italy, indicating that average personnel costs were higher than apparent labour productivity. In contrast, the wage-adjusted labour productivity ratio in Bulgaria was, at 200.3 %, the highest among the Member States. Bulgaria and Estonia (161.3 %) were the only Member States that recorded higher wage-adjusted labour productivity ratios for architectural and technical services than for their non-financial business economies as a whole in 2009; a similar situation was apparent in Croatia.
The relatively high gross operating rate observed for the EU-27’s architectural and technical services sector in 2009 was mainly due to high rates for several large Member States, notably Italy, the United Kingdom and Germany, while Bulgaria, Cyprus, Poland and Estonia also recorded relatively high rates – see Table 4b. Gross operating rates for architectural and technical services were higher than averages for the whole of the non-financial business economy in nearly all Member States, the rare exceptions being Ireland and Denmark; Norway also recorded a gross operating rate for the architectural and technical services sector that was below average its non-financial business economy average.
Data sources and availability
The analysis presented in this article is based on the main dataset for structural business statistics (SBS) which are disseminated annually. The series provides information for each Member State as well as a number of non-member countries at a detailed level according to the activity classification NACE. Data are available for a wide range of variables.
Context
This article presents an overview of statistics for the architectural and technical services sector in the EU, as covered by NACE Rev. 2 Division 71. This division includes the provision of architectural services such as consulting, design and drafting services, town planning and engineering services such as engineering design and implementation, geophysical, geological and seismic surveying, and mapping services. The architectural and technical services sector also includes the performance of physical, chemical, and other analytical testing services of materials and products, including, for example, testing activities in the field of food hygiene, reliability testing, testing and measuring of environmental indicators, the operation of police laboratories, and the certification of products such as transport equipment.
This NACE division is composed of two groups:
- architectural and engineering activities (Group 71.1);
- technical testing and analysis (Group 71.2).
The information that is presented in this article does not cover test drilling in connection with mining operations (classified as part of mining support service activities, Division 09), research and development activities related to engineering (included as part of scientific research and development, Division 72), or industrial design, aerial photography and interior decorating (which form part of other professional, scientific and technical activities, Division 74).
Further Eurostat information
Publications
Main tables
Database
- SBS – services (sbs_serv)
- Annual detailed enterprise statistics - services (sbs_na_serv)
- Annual detailed enterprise statistics for services (NACE Rev.2 H-N and S95) (sbs_na_1a_se_r2)
- Preliminary results on services, main indicators (NACE Rev.2) (sbs_sc_r2preli)
- SMEs - Annual enterprise statistics broken down by size classes - services (sbs_sc_sc)
- Services broken down by employment size classes (NACE Rev.2 H-N and S95) (sbs_sc_1b_se_r2)
- Annual detailed enterprise statistics - services (sbs_na_serv)
- SBS - regional data - all activities (sbs_r)
- SBS data by NUTS 2 regions and NACE Rev.2, from 2008 onwards (sbs_r_nuts06_r2)
Dedicated section
Source data for tables, figures and maps (MS Excel)
Other information
- Regulation 58/1997 of 20 December 1996 concerning structural business statistics
- Decision 2367/2002/EC of 16 December 2002 on the Community statistical programme 2003 to 2007
- Regulation 295/2008 of 11 March 2008 concerning structural business statistics