,_latest_available_year_.png)
, latest available year .png&body=Statistics Explained - EGSS production, % of GDP, by type of activity (market, non market, ancillary), latest available year .png %0A https%3A%2F%2Fec.europa.eu%2Feurostat%2Fstatistics-explained%2Findex.php%3Ftitle%3DFile%3AEGSS_production%2C_%2525_of_GDP%2C_by_type_of_activity_%28market%2C_non_market%2C_ancillary%29%2C_latest_available_year_.png)
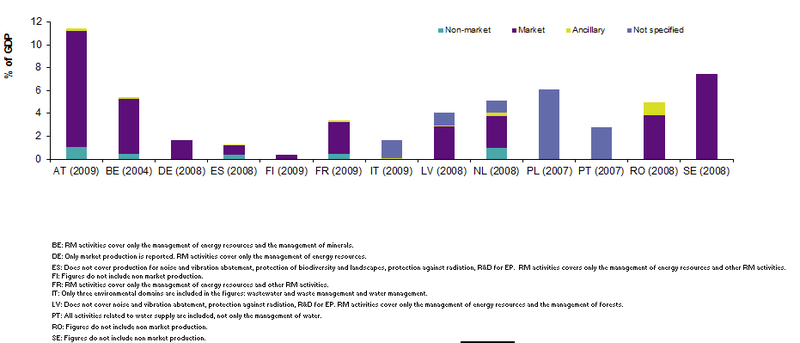
File:EGSS production, % of GDP, by type of activity (market, non market, ancillary), latest available year .png
,_latest_available_year_.png&diff=prev&oldid=175298)
,_latest_available_year_.png&direction=prev&oldid=175298)

Size of this preview: 800 × 343 pixels. Other resolutions: 320 × 137 pixels | 931 × 399 pixels.
Original file (931 × 399 pixels, file size: 10 KB, MIME type: image/png)
Trends in EGSS total output and breakdown by market, non-market and ancillary activities for EU28
Figure created with data from March 2014
Most recent data available now, see:
Production, value added and exports in environmental goods and services sector (env_ac_egss2)
File usage
There are no pages that use this file.
,_latest_available_year_.png&oldid=175298)
,_latest_available_year_.png)
,_latest_available_year_.png&action=edit&redlink=1)
,_latest_available_year_.png&action=history)