Archive:Enlargement countries - international trade in goods statistics
- Data from Month Year, most recent data: Further Eurostat information, Main tables and Database.
This article focuses on the structure and evolution of the external trade: import and exports. The geographical areas in focus are the European Union (EU), Candidate and Potential Candidate Countries as well as ENP countries. It also provides information on the trade balance in goods and a breakdown by selected product groups. A number of figures on the international trade in goods have been aggregated (as a share of GDP) for the UE-27 and for selected enlargement countries.
Introduction
Why do we need statistics on trade? Indeed, trade statistics are of prime importance for both public and private users, as they provide valuable information on the current trends in the production and exchange of goods within a specific geographical area. Moreover, they enable European Community authorities to prepare multilateral and bilateral negotiations on a common trade policy. Furthermore, they help European businesses to carry out market surveys and, thus, improve their competitiveness.
The context in which trade statistics are collected has changed radically in recent years, not only within European Union but also in enlargement countries. The economic impact of globalisation on the EU has had its effect on the trade in goods and services, as well as on the financial flows and the movement of persons linked to cross-border economic activity. Globalisation acquires an even higher profile when it is measured by actual trade flows. In view of the future enlargement of the European Union and taking into account the importance of trade for the members of the Candidate and Potential Candidate countries, as well as ENP countries, the EU has been faced with an unprecedented demand for high quality trade statistics to support the EU policy decision – making
Main statistical findings
Deficits on external trade in goods
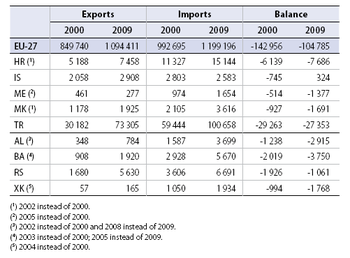
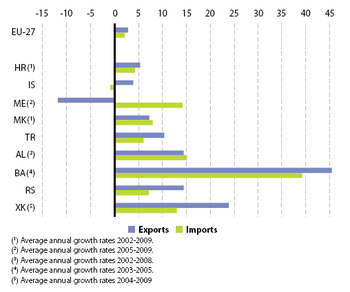
The EU-27’s exports of goods to the rest of the world grew by almost 30% between 2000 and 2009. Every enlargement country apart from Montenegro saw exports grow faster than those of the EU-27 over recent years. In Albania, Bosnia and Herzegovina, Kosovo, Serbia and Turkey exports more than doubled in the past few years. Only in Montenegro did exports fall (by almost 40%) between 2005 and 2009. The EU-27’s imports of goods grew by just over 20% between 2000 and 2009. As regards enlargement countries, only in Iceland did imports fall (by 8%) between 2000 and 2009, while the other countries recorded a rise well above the EU-27’s increase of 20%.
The EU-27’s trade in goods deficit was just under 5% of total trade in 2009 (exports and imports combined), a decrease from almost 8% in 2000. Iceland was the only one of the enlargement countries to show a trade in goods surplus (of EUR 324 million) in 2009. In both 2000 and 2009 the recorded deficit in Kosovo was over 80% of total trade and in Albania over 60%, the two highest values recorded in all of the enlargement countries. The most notable change in the overall values was recorded in Serbia, which saw its previous deficit reduce from 36% of total trade to 9% between 2000 and 2009, and in Montenegro, which recorded an increase in deficit from 36% to 71% between 2005 and 2009.
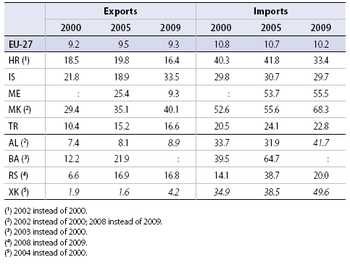
The EU-27’s exports of goods were equal to just over 9% of the gross domestic product (GDP) in 2009. In Albania, Kosovo and Montenegro the share of exports in GDP did not exceed the EU-27 value. In all the other enlargement countries the figure for exports as a percentage of GDP was much higher, particularly in Iceland and the former Yugoslav Republic of Macedonia, where exports amounted to over one third of GDP (according to the latest data available). The EU-27’s imports were equal to just over 10% of GDP in 2009. Imports to each of the enlargement countries reached higher values than those recorded in the EU-27, most notably in the former Yugoslav Republic of Macedonia and Montenegro, where they equaled more than one half of GDP (according to the latest data available).
The main trading partner for the enlargement countries
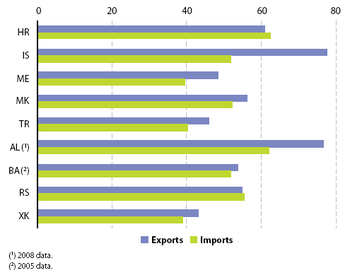
The EU-27 has long been the main trading partner for the enlargement countries. According to the latest data available, over 75% of exports from Albania and Iceland went to the EU-27. Moreover, even the lowest rates in this category, recorded in Kosovo and Turkey, were around 45%. Looking at imports, on the other hand, Kosovo and Montenegro saw less than 40% of those arrive from the EU-27, whereas in Albania and Croatia the imports amounted to over 60%.
Manufactured goods excluding machinery and vehicles are generally the most important product category in trade
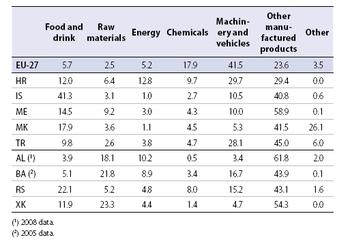
Manufactured goods, excluding machinery and vehicles (‘Other manufactured products’ in Table 7.3), made up by far the biggest category of exports for enlargement countries, with the exception of Croatia and Iceland, (as per the latest information available). This category of goods accounted for almost 62% of exports from Albania, almost 59% of exports from Montenegro and just over 54% of exports from Kosovo. In 2009, the largest category of goods exported from Croatia, as well as from the EU-27 (41.5%), was machinery and vehicles (29.7%).In Iceland the largest category exported was food and drinks, which made up just over 41% of that country’s exports.
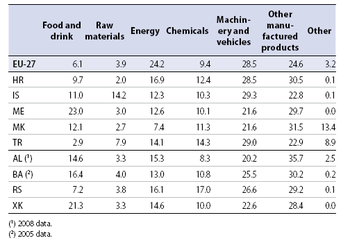
By and large, manufactured goods, excluding machinery and vehicles, also had the highest share in imports. Most of the enlargement countries saw nearly 30% of their imports fall into this category (as per the latest data available). The exceptions were Iceland and Turkey, where it was actually machinery and vehicles that accounted for the highest share (respectively 29.3% and 29%) of imports of goods in 2009, same as in the EU-27 (28.5%).
Data sources and availability
The source of external trade statistics are the annual questionnaires sent to the enlargement countries, as well as Comext which is the Eurostat database containing detailed external trade data for the EU and its Member States. External trade statistics are normally recorded by CC, PC and ENP countries on the basis of customs declarations submitted by the trader when clearing customs. The statistics on external trade were extracted from Eurostat’s free dissemination database Easy Comext. COMEXT is the Eurostat reference database for external trade. It provides access not only to both recent and historical data from the EU Member States and enlargements countries, but also to statistics of a significant number of third countries. The aggregated data on external trade and the detailed statistics which are disseminated from Eurostat’s website are compiled from COMEXT data on a monthly basis. Note that because COMEXT is updated on a daily basis, data published on the website may sometimes temporarily differ from the data stored in COMEXT.
<description of data sources, survey and data availability (completeness, recency) and limitations>
Further Eurostat information
Publications
Main tables
Database
- External trade (cpc_et)
Methodology / Metadata
Dedicated section
External links
- European Commission - Enlargement
- European Commission - Stability and Growth Pact
- European Commission - Trade