_(%25_of_the_total_population).png)
 (% of the total population).png&body=Statistics Explained - Population pyramids, EU-27, 2010 and 2060 (1) (% of the total population).png %0A https%3A%2F%2Fec.europa.eu%2Feurostat%2Fstatistics-explained%2Findex.php%3Ftitle%3DFile%3APopulation_pyramids%2C_EU-27%2C_2010_and_2060_%281%29_%28%2525_of_the_total_population%29.png)
File:Population pyramids, EU-27, 2010 and 2060 (1) (% of the total population).png
_(%25_of_the_total_population).png&diff=prev&oldid=118923)
_(%25_of_the_total_population).png&direction=prev&oldid=118923)
No higher resolution available.
Population_pyramids,_EU-27,_2010_and_2060_(1)_(%_of_the_total_population).png (541 × 381 pixels, file size: 6 KB, MIME type: image/png)
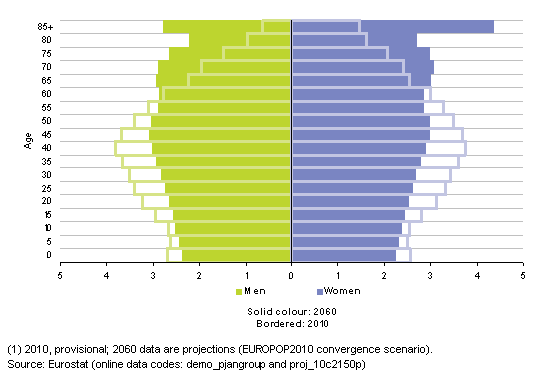
Population pyramids, EU-27, 2010 and 2060 (1)
- (% of the total population)
Figure created with data from September 2011
Most recent data available now, see:
Population on 1 January by five years age groups and sex=demo_pjangroup ({{{code}}})
1st January population by sex and 5-year age groups (proj_10c2150p)
File usage
There are no pages that use this file.
_(%25_of_the_total_population).png&oldid=118923)
_(%25_of_the_total_population).png)
_(%25_of_the_total_population).png&action=edit&redlink=1)
_(%25_of_the_total_population).png&action=history)