.PNG)
.PNG&body=Statistics Explained - Top 20 NUTS 2 regions with highest volume of maritime goods, 2009 (continued).PNG %0A https%3A%2F%2Fec.europa.eu%2Feurostat%2Fstatistics-explained%2Findex.php%3Ftitle%3DFile%3ATop_20_NUTS_2_regions_with_highest_volume_of_maritime_goods%2C_2009_%28continued%29.PNG)
File:Top 20 NUTS 2 regions with highest volume of maritime goods, 2009 (continued).PNG
Revision as of 10:12, 30 November 2011 by Verdodo (talk | contribs) (→Most recent data available now, see:)
.PNG&diff=prev&oldid=72336)
.PNG&direction=prev&oldid=72336)
Size of this preview: 601 × 600 pixels. Other resolutions: 241 × 240 pixels | 837 × 835 pixels.
Original file (837 × 835 pixels, file size: 58 KB, MIME type: image/png)
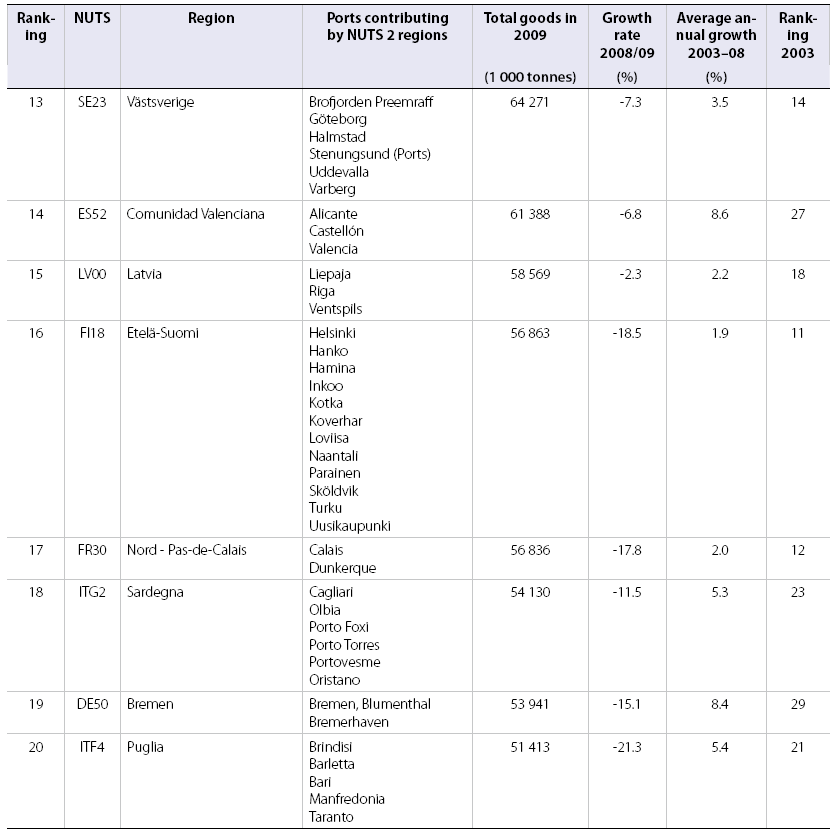
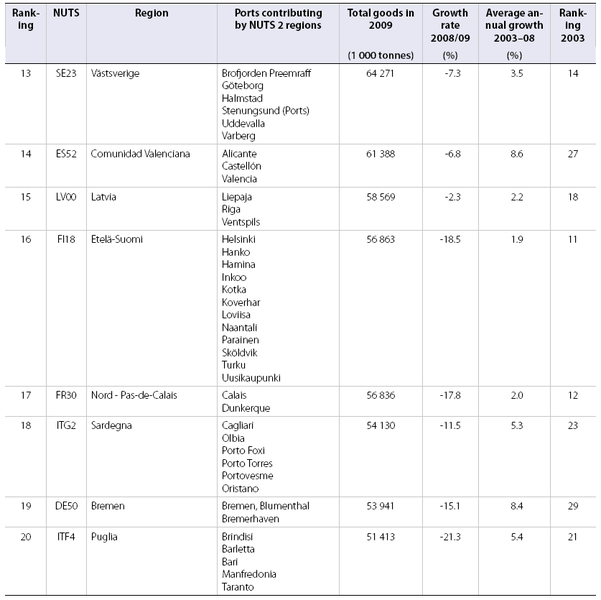
Top 20 NUTS 2 regions with highest volume of maritime goods, 2009 (continued)
- (1 000 tonnes of total goods loaded and unloaded)
Table created with data from March 2011
Most recent data available now, see:
Maritime transport of freight at regional level (tran_r_mago_nm)
File usage
The following page uses this file:
.PNG&oldid=72336)
.PNG)
.PNG&action=edit&redlink=1)
.PNG&action=history)