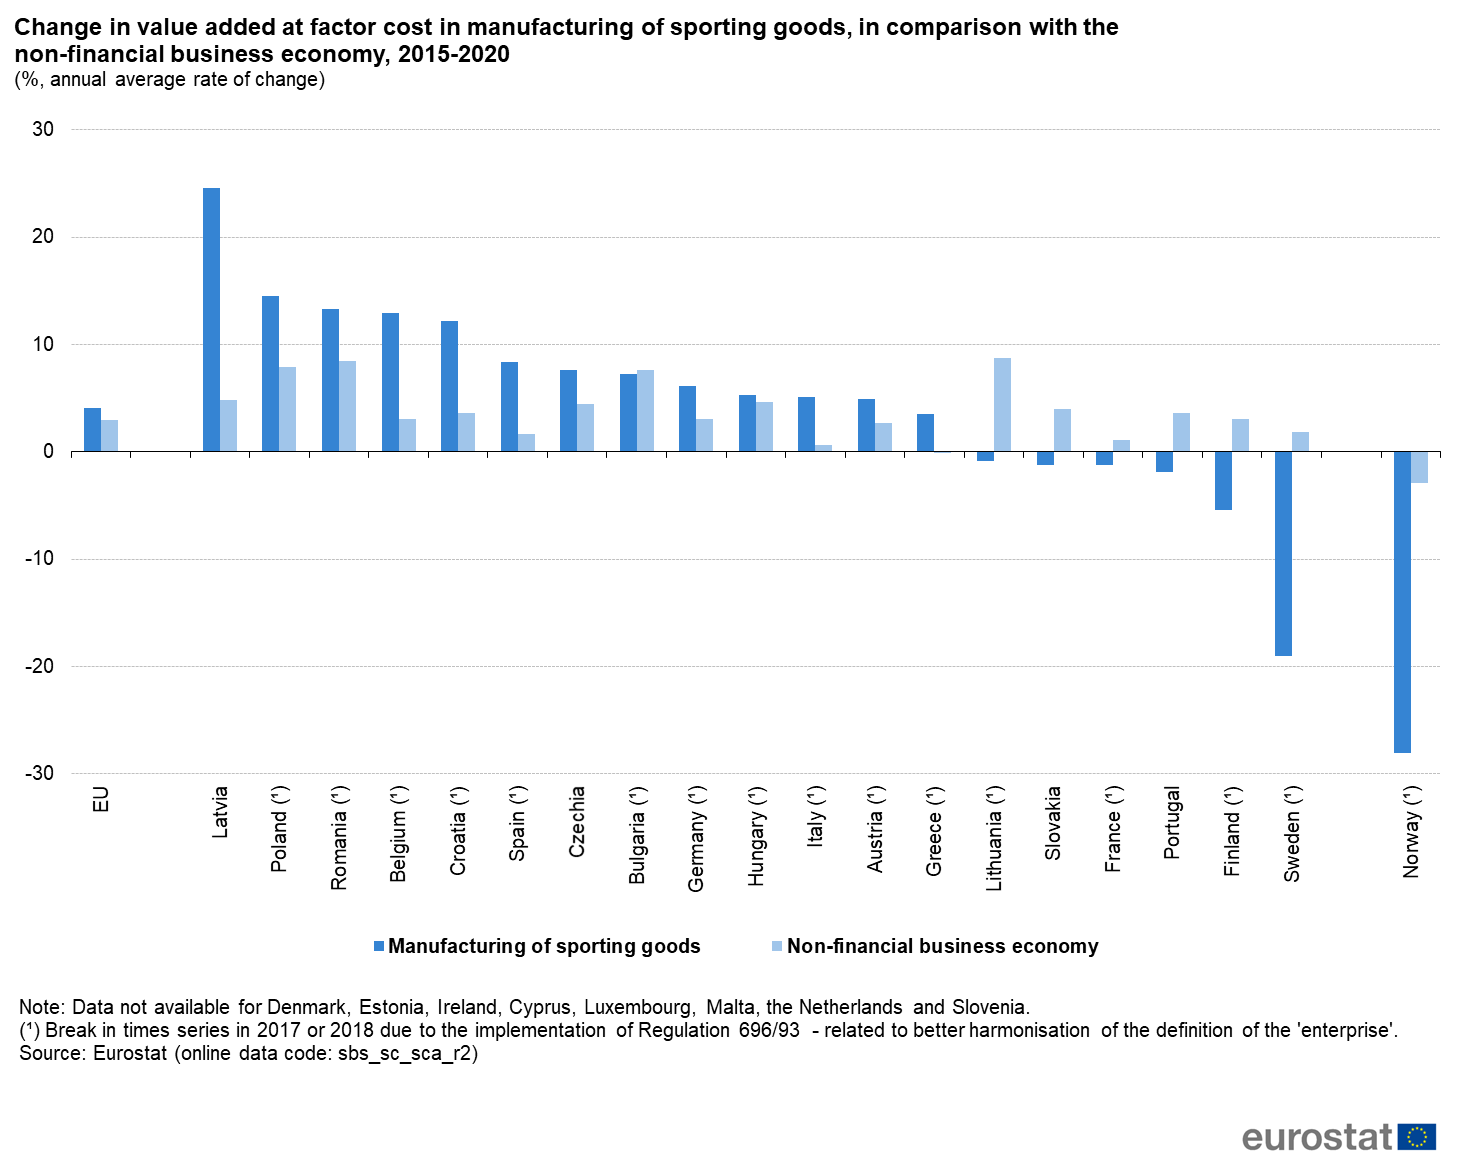
File:Figure 3 - Change in value added in manufacturing of sporting goods, in comparison with non-financial business economy, 2015-2020.png
Revision as of 12:00, 18 April 2023 by Lombrob (talk | contribs) (Lombrob uploaded a new version of File:Figure 3 - Change in value added in manufacturing of sporting goods, in comparison with non-financial business economy, 2015-2020.png)
Size of this preview: 753 × 600 pixels. Other resolutions: 302 × 240 pixels | 1,462 × 1,164 pixels.
Original file (1,462 × 1,164 pixels, file size: 101 KB, MIME type: image/png)
File usage
There are no pages that use this file.