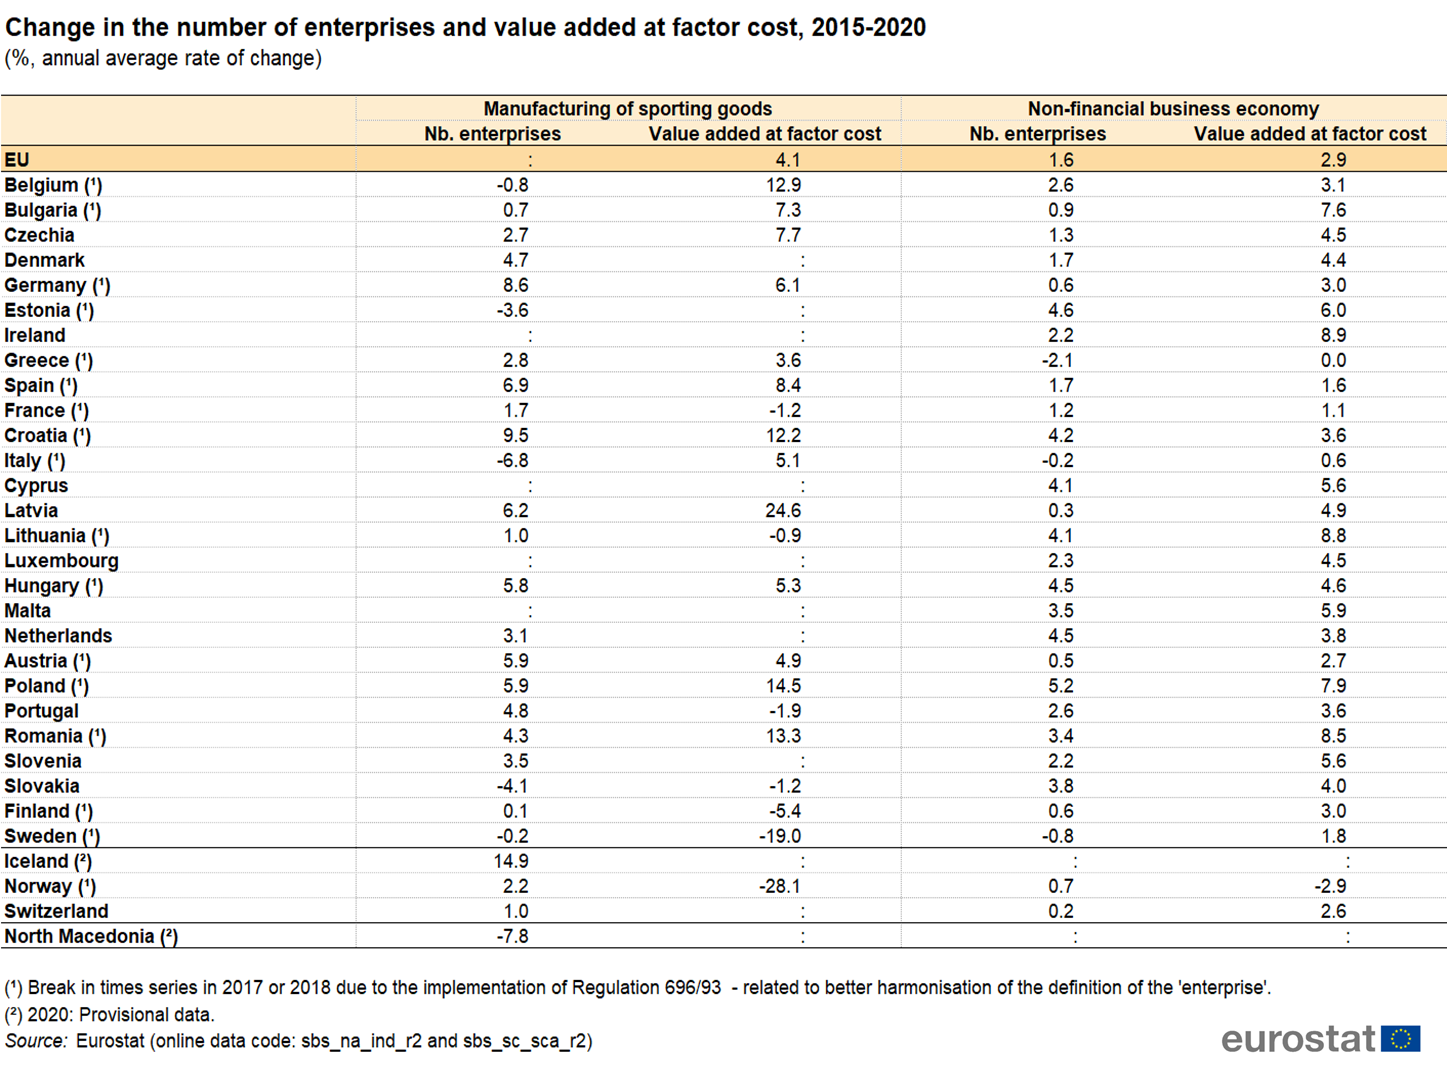
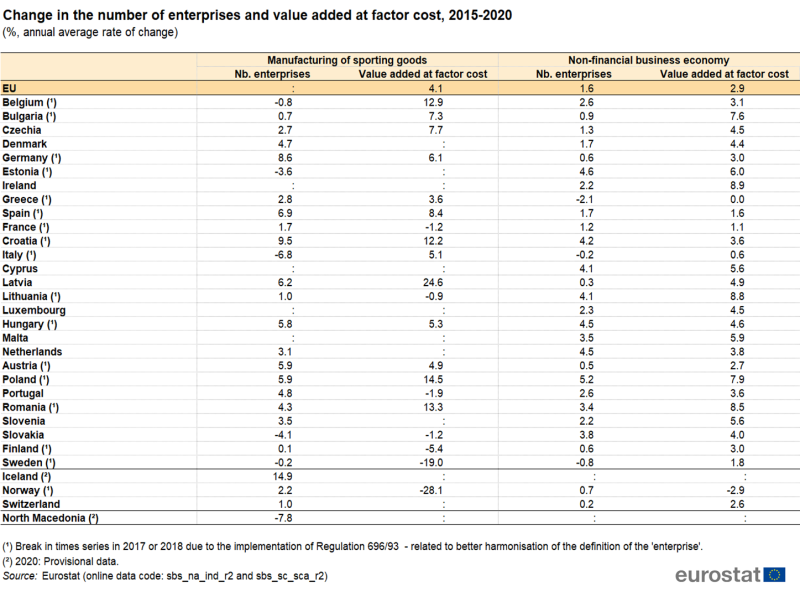
File:Table 2 - Change in the number of enterprises and value added at factor cost in manufacturing of sporting goods, 2015-2020.png
Revision as of 11:56, 18 April 2023 by Lombrob (talk | contribs) (Lombrob uploaded a new version of File:Table 2 - Change in the number of enterprises and value added at factor cost in manufacturing of sporting goods, 2015-2020.png)
Size of this preview: 800 × 597 pixels. Other resolutions: 320 × 239 pixels | 1,447 × 1,079 pixels.
Original file (1,447 × 1,079 pixels, file size: 455 KB, MIME type: image/png)
File usage
There are no pages that use this file.