.png)
.png&body=Statistics Explained - Figure 2 - Harmonised indices of consumer prices for selected sporting goods and services, EU, annual average rates of change 2017-2022 and 2021-2022 (%).png %0A https%3A%2F%2Fec.europa.eu%2Feurostat%2Fstatistics-explained%2Findex.php%3Ftitle%3DFile%3AFigure_2_-_Harmonised_indices_of_consumer_prices_for_selected_sporting_goods_and_services%2C_EU%2C_annual_average_rates_of_change_2017-2022_and_2021-2022_%28%2525%29.png)
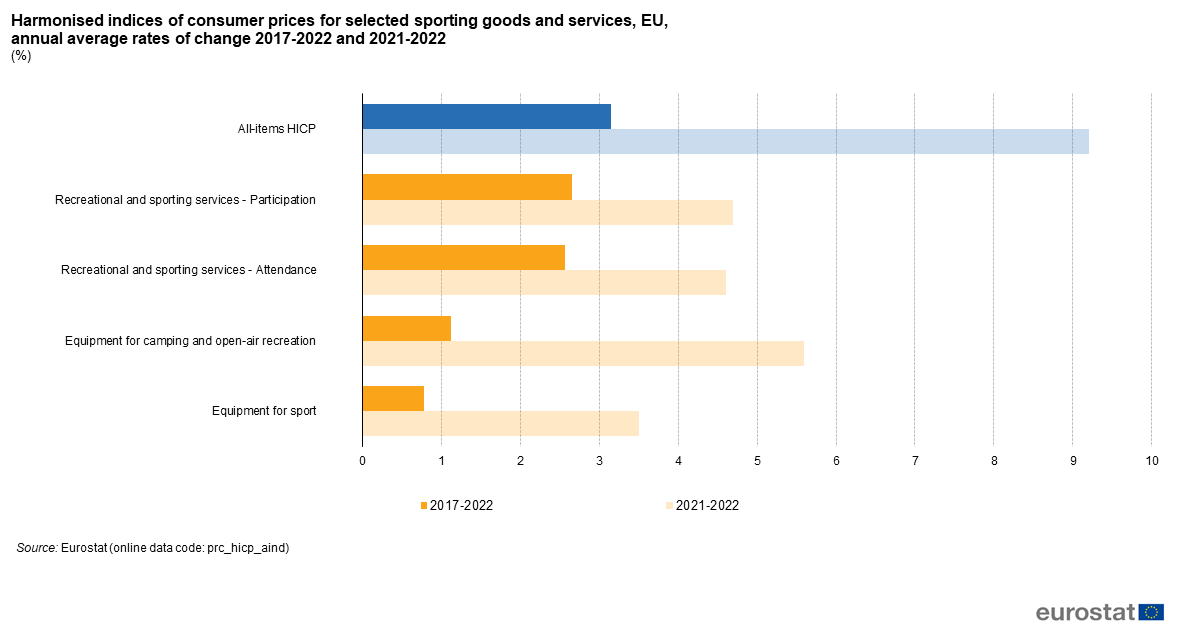
File:Figure 2 - Harmonised indices of consumer prices for selected sporting goods and services, EU, annual average rates of change 2017-2022 and 2021-2022 (%).png
Revision as of 10:01, 23 March 2023 by Lombrob (talk | contribs) (Lombrob uploaded a new version of File:Figure 2 - Harmonised indices of consumer prices for selected sporting goods and services, EU, annual average rates of change 2017-2022 and 2021-2022 (%).png)
.png)
.png&diff=prev&oldid=596375)
.png&direction=prev&oldid=596375)
Size of this preview: 800 × 426 pixels. Other resolutions: 320 × 170 pixels | 1,181 × 629 pixels.
Original file (1,181 × 629 pixels, file size: 62 KB, MIME type: image/png)
File usage
There are no pages that use this file.
.png&oldid=596375)
.png&action=edit&redlink=1)
.png&action=history)