,_Evolution_of_main_indicators,_EU-27_(2000%3D100),_2007.PNG)
, Evolution of main indicators, EU-27 (2000=100), 2007.PNG&body=Statistics Explained - Business services (NACE Divisions 72 and 74), Evolution of main indicators, EU-27 (2000=100), 2007.PNG %0A https%3A%2F%2Fec.europa.eu%2Feurostat%2Fstatistics-explained%2Findex.php%3Ftitle%3DFile%3ABusiness_services_%28NACE_Divisions_72_and_74%29%2C_Evolution_of_main_indicators%2C_EU-27_%282000%253D100%29%2C_2007.PNG)
File:Business services (NACE Divisions 72 and 74), Evolution of main indicators, EU-27 (2000=100), 2007.PNG
Revision as of 14:42, 11 May 2011 by Verdodo (talk | contribs) (→Graph created with data from January 2009)
,_Evolution_of_main_indicators,_EU-27_(2000%3D100),_2007.PNG&diff=prev&oldid=56798)
,_Evolution_of_main_indicators,_EU-27_(2000%3D100),_2007.PNG&direction=prev&oldid=56798)
Size of this preview: 800 × 384 pixels. Other resolutions: 320 × 154 pixels | 804 × 386 pixels.
Original file (804 × 386 pixels, file size: 32 KB, MIME type: image/png)
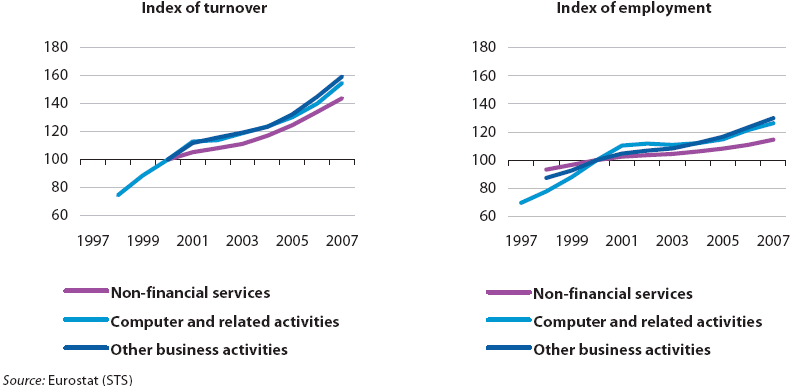
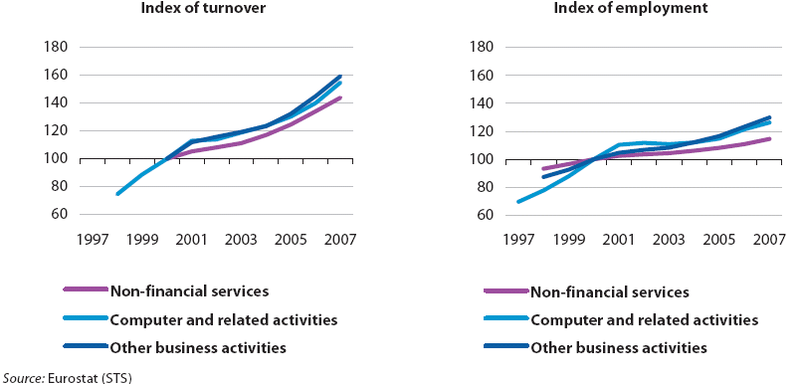
Business services (NACE Divisions 72 and 74), Evolution of main indicators, EU-27 (2000=100), 1997-2007
Figure created with data from January 2009
File usage
The following page uses this file:
,_Evolution_of_main_indicators,_EU-27_(2000%3D100),_2007.PNG&oldid=56798)
,_Evolution_of_main_indicators,_EU-27_(2000%3D100),_2007.PNG)
,_Evolution_of_main_indicators,_EU-27_(2000%3D100),_2007.PNG&action=edit&redlink=1)
,_Evolution_of_main_indicators,_EU-27_(2000%3D100),_2007.PNG&action=history)