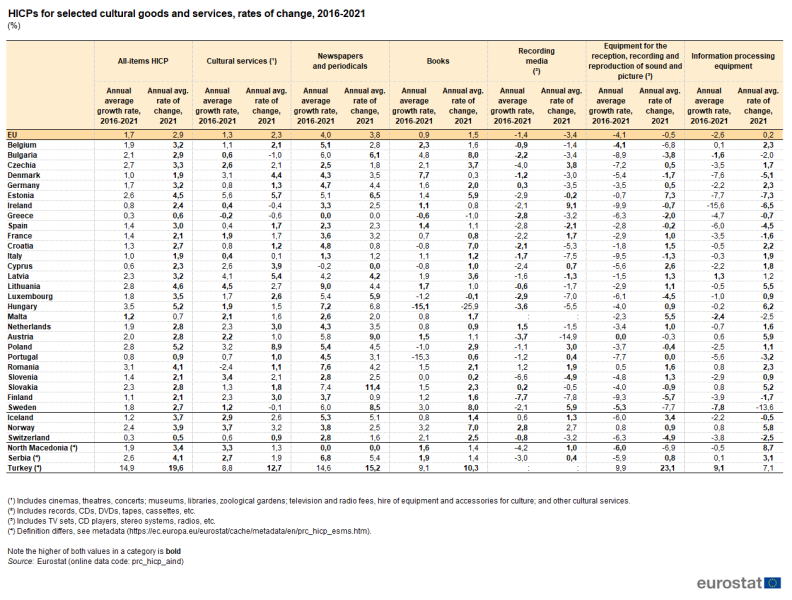
File:Table 1 - HICPs for selected cultural goods and services, rates of change, 2016-2021 (%).png
Revision as of 11:17, 29 March 2022 by Lombrob (talk | contribs) (Lombrob uploaded a new version of File:Table 1 - HICPs for selected cultural goods and services, rates of change, 2016-2021 (%).png)

Size of this preview: 792 × 600 pixels. Other resolutions: 317 × 240 pixels | 1,256 × 951 pixels.
Original file (1,256 × 951 pixels, file size: 121 KB, MIME type: image/png)
null
File usage
There are no pages that use this file.