_by_country_in_Q2_2020_and_in_Q3_2021_compared_to_Q4_2019_(people_aged_15-74,_in_p_p_,_protocol_order_1st_set,_seasonally_adjusted_data).png)
 by country in Q2 2020 and in Q3 2021 compared to Q4 2019 (people aged 15-74, in p p , protocol order 1st set, seasonally adjusted data).png&body=Statistics Explained - Change in the labour categories (in % of the population) by country in Q2 2020 and in Q3 2021 compared to Q4 2019 (people aged 15-74, in p p , protocol order 1st set, seasonally adjusted data).png %0A https%3A%2F%2Fec.europa.eu%2Feurostat%2Fstatistics-explained%2Findex.php%3Ftitle%3DFile%3AChange_in_the_labour_categories_%28in_%2525_of_the_population%29_by_country_in_Q2_2020_and_in_Q3_2021_compared_to_Q4_2019_%28people_aged_15-74%2C_in_p_p_%2C_protocol_order_1st_set%2C_seasonally_adjusted_data%29.png)
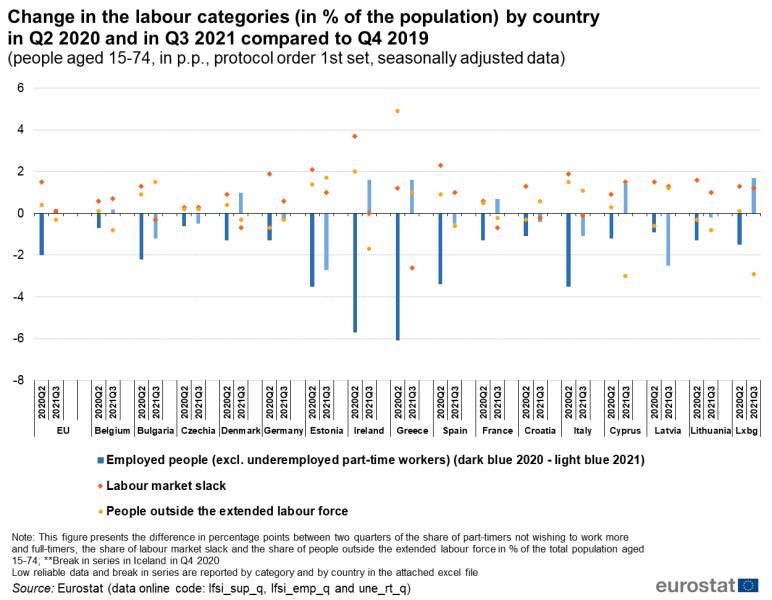
File:Change in the labour categories (in % of the population) by country in Q2 2020 and in Q3 2021 compared to Q4 2019 (people aged 15-74, in p p , protocol order 1st set, seasonally adjusted data).png
Revision as of 10:47, 7 April 2022 by Villegv (talk | contribs) (Villegv uploaded a new version of File:Change in the labour categories (in % of the population) by country in Q2 2020 and in Q3 2021 compared to Q4 2019 (people aged 15-74, in p p , protocol order 1st set, seasonally adjusted data).png)
_by_country_in_Q2_2020_and_in_Q3_2021_compared_to_Q4_2019_(people_aged_15-74,_in_p_p_,_protocol_order_1st_set,_seasonally_adjusted_data).png)
_by_country_in_Q2_2020_and_in_Q3_2021_compared_to_Q4_2019_(people_aged_15-74,_in_p_p_,_protocol_order_1st_set,_seasonally_adjusted_data).png&diff=prev&oldid=561533)
_by_country_in_Q2_2020_and_in_Q3_2021_compared_to_Q4_2019_(people_aged_15-74,_in_p_p_,_protocol_order_1st_set,_seasonally_adjusted_data).png&direction=prev&oldid=561533)

Size of this preview: 772 × 600 pixels. Other resolutions: 309 × 240 pixels | 1,250 × 971 pixels.
Original file (1,250 × 971 pixels, file size: 107 KB, MIME type: image/png)
File usage
There are no pages that use this file.
_by_country_in_Q2_2020_and_in_Q3_2021_compared_to_Q4_2019_(people_aged_15-74,_in_p_p_,_protocol_order_1st_set,_seasonally_adjusted_data).png&oldid=561533)
_by_country_in_Q2_2020_and_in_Q3_2021_compared_to_Q4_2019_(people_aged_15-74,_in_p_p_,_protocol_order_1st_set,_seasonally_adjusted_data).png&action=edit&redlink=1)
_by_country_in_Q2_2020_and_in_Q3_2021_compared_to_Q4_2019_(people_aged_15-74,_in_p_p_,_protocol_order_1st_set,_seasonally_adjusted_data).png&action=history)