.png)
.png&body=Statistics Explained - Figure 4 Forestry and logging gross value added per area of forest, 2000 and 2019 (€ hectare, current prices).png %0A https%3A%2F%2Fec.europa.eu%2Feurostat%2Fstatistics-explained%2Findex.php%3Ftitle%3DFile%3AFigure_4_Forestry_and_logging_gross_value_added_per_area_of_forest%2C_2000_and_2019_%28%25E2%2582%25AC_hectare%2C_current_prices%29.png)
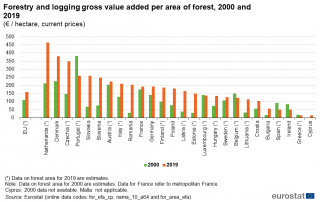
File:Figure 4 Forestry and logging gross value added per area of forest, 2000 and 2019 (€ hectare, current prices).png
Revision as of 17:25, 21 December 2021 by Vysnave (talk | contribs) (Vysnave uploaded a new version of File:Figure 4 Forestry and logging gross value added per area of forest, 2000 and 2019 (€ hectare, current prices).png)
.png)
.png&diff=prev&oldid=551054)
.png&direction=prev&oldid=551054)

Size of this preview: 800 × 505 pixels. Other resolutions: 320 × 202 pixels | 1,001 × 632 pixels.
Original file (1,001 × 632 pixels, file size: 71 KB, MIME type: image/png)
null
File usage
There are no pages that use this file.
.png&oldid=551054)
.png&action=edit&redlink=1)
.png&action=history)