_.png)
 .png&body=Statistics Explained - Table 2 Population change components, 2050 (cumulated NUTS 3 regions per country) .png %0A https%3A%2F%2Fec.europa.eu%2Feurostat%2Fstatistics-explained%2Findex.php%3Ftitle%3DFile%3ATable_2_Population_change_components%2C_2050_%28cumulated_NUTS_3_regions_per_country%29_.png)
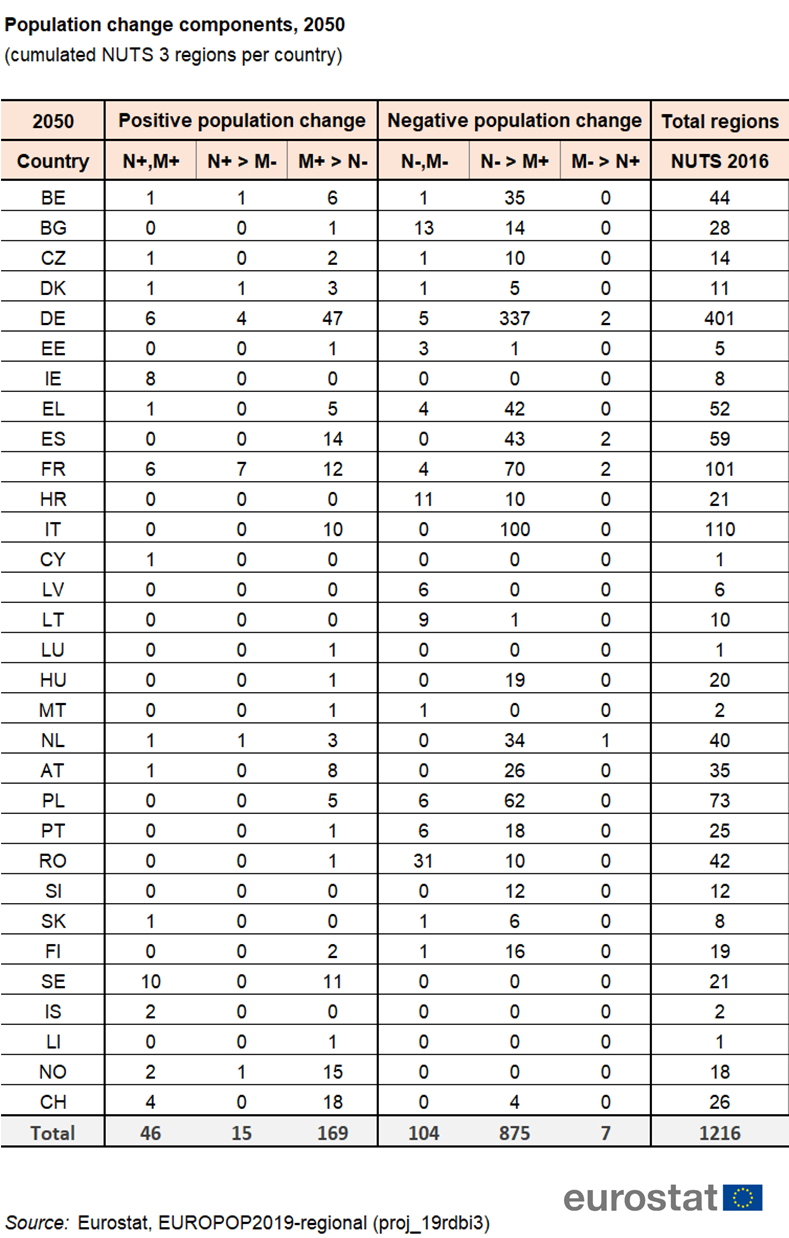
File:Table 2 Population change components, 2050 (cumulated NUTS 3 regions per country) .png
Revision as of 19:16, 19 March 2021 by Senchga (talk | contribs) (Senchga uploaded a new version of "File:Table 2 Population change components, 2050 (cumulated NUTS 3 regions per country) .png")
_.png)
_.png&diff=prev&oldid=519288)
_.png&direction=prev&oldid=519288)
_.png&diff=cur&oldid=519288)
_.png&direction=next&oldid=519288)
_.png&diff=next&oldid=519288)
Size of this preview: 382 × 599 pixels. Other resolutions: 153 × 240 pixels | 789 × 1,238 pixels.
Original file (789 × 1,238 pixels, file size: 269 KB, MIME type: image/png)
File usage
There are no pages that use this file.
_.png&oldid=519288)
_.png&action=edit&redlink=1)
_.png&action=history)