.png)
.png&body=Statistics Explained - Figure 7 Sold production of basic pharmaceutical products in the EU-27, 2009-2019 (in bil EUR).png %0A https%3A%2F%2Fec.europa.eu%2Feurostat%2Fstatistics-explained%2Findex.php%3Ftitle%3DFile%3AFigure_7_Sold_production_of_basic_pharmaceutical_products_in_the_EU-27%2C_2009-2019_%28in_bil_EUR%29.png)
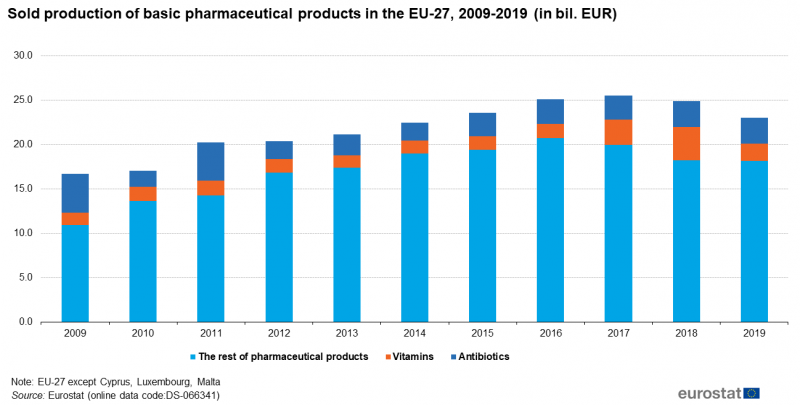
File:Figure 7 Sold production of basic pharmaceutical products in the EU-27, 2009-2019 (in bil EUR).png
Revision as of 13:12, 21 January 2021 by Verdodo (talk | contribs) (Verdodo uploaded a new version of "File:Figure 7 Sold production of basic pharmaceutical products in the EU-27, 2009-2019 (in bil EUR).png")
.png)
.png&diff=prev&oldid=512630)
.png&direction=prev&oldid=512630)

Size of this preview: 800 × 405 pixels. Other resolutions: 320 × 162 pixels | 1,298 × 657 pixels.
Original file (1,298 × 657 pixels, file size: 60 KB, MIME type: image/png)
File usage
There are no pages that use this file.
.png&oldid=512630)
.png&action=edit&redlink=1)
.png&action=history)