_CP2019.png)
 CP2019.png&body=Statistics Explained - Change in the number of enterprises and value added at factor cost, 2011-2016 (%, annual average rate of change) CP2019.png %0A https%3A%2F%2Fec.europa.eu%2Feurostat%2Fstatistics-explained%2Findex.php%3Ftitle%3DFile%3AChange_in_the_number_of_enterprises_and_value_added_at_factor_cost%2C_2011-2016_%28%2525%2C_annual_average_rate_of_change%29_CP2019.png)
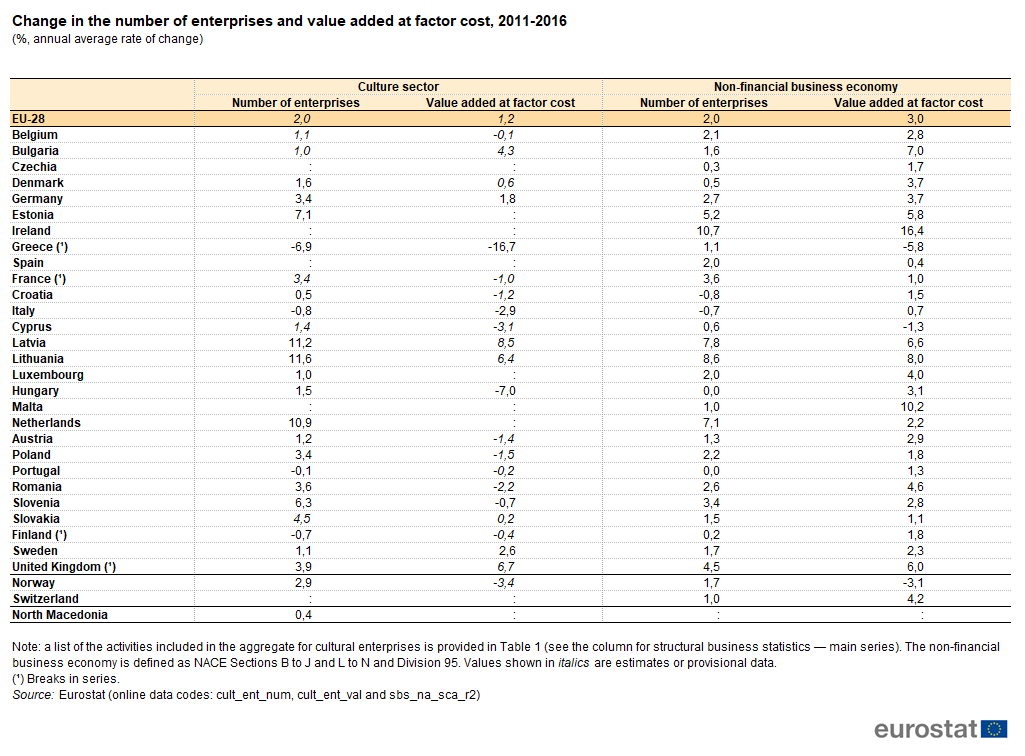
File:Change in the number of enterprises and value added at factor cost, 2011-2016 (%, annual average rate of change) CP2019.png
Revision as of 09:02, 18 September 2019 by Lombrob (talk | contribs) (Lombrob uploaded a new version of "File:Change in the number of enterprises and value added at factor cost, 2011-2016 (%, annual average rate of change) CP2019.png")
_CP2019.png)
_CP2019.png&diff=prev&oldid=451136)
_CP2019.png&direction=prev&oldid=451136)
Size of this preview: 800 × 590 pixels. Other resolutions: 320 × 236 pixels | 1,025 × 756 pixels.
Original file (1,025 × 756 pixels, file size: 65 KB, MIME type: image/png)
File usage
There are no pages that use this file.
_CP2019.png&oldid=451136)
_CP2019.png&action=edit&redlink=1)
_CP2019.png&action=history)