Archive:Urban-rural typology
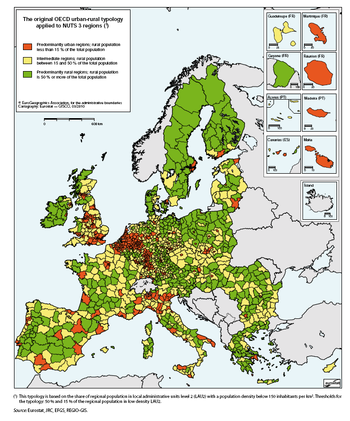
This article presents a new European Union (EU) typology of 'predominantly rural', 'intermediate' or 'predominantly urban' regions based on a variation of the OECD methodology (see Map 1). The aim of this new typology is to provide a consistent basis for the description of these three distinct types of regions in all European Commission communications, reports and publications, including Eurostat statistical analyses.
Why a new typology?
Using the current OECD methodology to classify NUTS 3 regions in the EU creates two types of distortions that undermine its comparability within the EU. The first distortion is due to the large variation in the area of local administrative units level 2 (LAU2). The second distortion is due to the large variation in the surface area of NUTS 3 regions and the practice in some countries to separate a (small) city centre from the surrounding region. This article first describes the OECD methodology briefly. Secondly it shows how this new typology seeks to remediate these two issues with the existing OECD approach.
The OECD methodology
The OECD methodology [1] for defining the typology involves two main steps:
- defining rural local administrative units level 2;
- based on the population share in rural LAU2s, classifying regions.
Identifying rural local administrative units level 2
The OECD methodology classifies LAU2s with a population density below 150 inhabitants per km² as rural. Due to heterogeneity of the size in area of LAU2s, some LAU2s will be incorrectly classified.
- Small villages which are very tightly circumscribed by their administrative boundary have a sufficiently high density and therefore will be classified as urban despite having a very small total population. For example, Aldea de Trujillo in Spain is classified as urban despite having a population of only 439 inhabitants.
- Cities or towns in very large LAU2s will be classified as rural due to a low population density, even when the city is fairly large and the vast majority of the population of the LAU2 lives in that city. For example, Badajoz and Cáceres in Spain and Uppsala in Sweden are classified as rural despite all three having a population of 150 000 or more.
Classifying the regional level
The OECD approach classifies regions as predominantly urban, intermediate or predominantly rural based on the percentage of population living in local rural units.
A NUTS 3 region is classified as:
- predominantly urban (PU), if the share of population living in rural LAU2 is below 15 %;
- intermediate (IN), if the share of population living in rural LAU2 is between 15 % and 50 %;
- predominantly rural (PR), if the share of population living in rural LAU2 is higher than 50 %.
In a third step, the size of the urban centres in the region is considered.
- A region classified as predominantly rural by steps 1 and 2 becomes intermediate if it contains an urban centre of more than 200 000 inhabitants representing at least 25 % of the regional population.
- A region classified as intermediate by steps 1 and 2 becomes predominantly urban if it contains an urban centre of more than 500 000 inhabitants representing at least 25 % of the regional population.
The result of this approach can be seen on Map 2.
The OECD is also aware of the problems caused by the difference in surface area of NUTS 3 regions. To avoid these issues, the OECD uses NUTS 2 regions for this classification in Belgium, the Netherlands and Greece and spatial planning regions in Germany and NUTS 3 in all other OECD countries in the EU.
The new typology
Definition based on a population grid
The new typology builds on a simple two-step approach to identify population in urban areas:
- a population density threshold (300 inhabitants per km²) applied to grid cells of 1 km²;
- a minimum size threshold (5 000 inhabitants) applied to grouped grid cells above the density threshold.
The population living in rural areas is the population living outside the urban areas identified through the method described above.
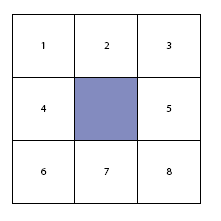
To determine the population size, the grid cells are grouped based on contiguity (including the diagonals); see Figure 1. If the central square in Figure 1 is above the density threshold, it will be grouped with each of the other surrounding eight cells that exceed the density threshold.
The 1 km² grid is already available for Denmark, Sweden, Finland, Austria and the Netherlands (see European Forum for GeoStatistics (EFGS)) and the new typology is based on the real grid in these Member States. For the remaining Member States, the new typology relies on the population disaggregation grid (version 5) created by the Joint Research Centre (JRC), based on LAU2 population and CORINE land cover.
The 1 km² grid is likely to become the future standard and has the benefit that it can easily be reproduced in countries outside the EU. For example, this typology can also be applied to Switzerland, Norway and Croatia following the exact same approach.
Because the CORINE land cover map does not cover the four French overseas regions and Madeira and Açores in Portugal, the population disaggregation grid does not cover these regions. Therefore, the OECD classification for these regions remains unchanged.
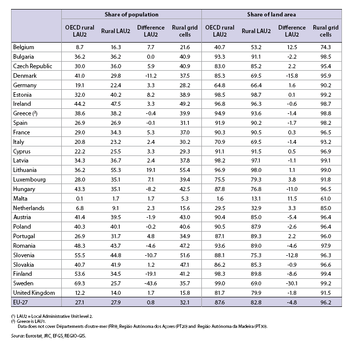
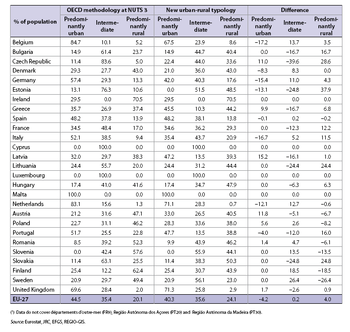
The approach based on the 1 km2 population grid classifies 68 % of the EU population as living in urban areas and 32 % as living in rural areas (see Table 1). This share is 5 percentage points higher than the original OECD definition. However, the share of population in rural LAU2s (defined as LAU2s with at least 50 % of the residents living in rural areas) is 28 %, i.e. very similar to that of the OECD. This classification will be further refined in the future.
This approach has the benefit that it creates a more balanced distribution of population. For example, the Member States with a very low share of population in rural areas see an increase of their population share in rural areas, such as in Germany, the Netherlands and Belgium. The Member States with very high shares of their population in rural areas and very large LAU2s see a reduction of their population in rural areas, particularly in Sweden, Finland and Denmark (see Table 1).
Definition at the regional level
How to define the regional level using the share of population in rural grid cells
This new typology uses the same threshold (50 %) to define a predominantly rural region, but uses the population share of rural grid cells and not rural LAU2s. By going straight from the grid to the regional level, the distortion of the variable size of the LAU2s is circumvented.
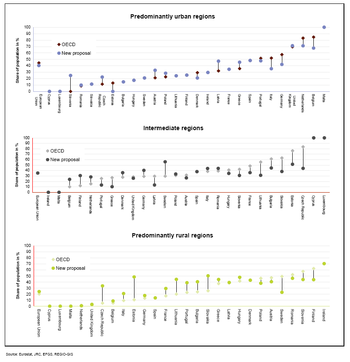
To ensure that the population share in predominantly urban regions does not differ too much from the original OECD classification applied to NUTS 3 regions, the threshold distinguishing predominantly urban from intermediate has been adjusted from 15 % to 20 % [2] (see Table 2 and Figure 2).
Researchers with a rural focus sometimes combine predominantly rural and intermediate and call them rural regions, in part because the OECD used the term ‘significantly rural’ before they replaced it with ‘intermediate’ in 1997. Researchers with an urban focus sometimes combine predominantly urban regions with intermediate and call it urban regions, based on the argument that in both regions more than half the population lives in urban LAU2s. Unfortunately, this approach leads to very conflicting statements where both 80 % of the EU population live in an urban region and 55 % live in a rural region because the intermediate regions are included in both groups. This chapter proposes to avoid these problems by consistently presenting data for the three groups separately.
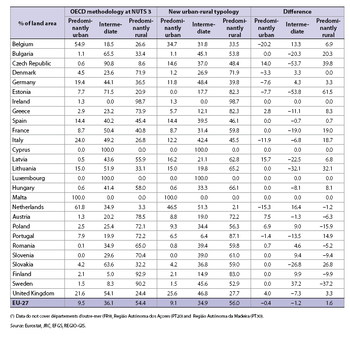
The new typology also changes the distribution of land area in each of the typologies (see Table 3), but less so than population at the EU level. In a number of countries the shifts between intermediate and predominantly rural are quite significant, as for example in the Czech Republic, Estonia and Sweden.
A classification of NUTS 3 regions and groupings of NUTS 3 regions
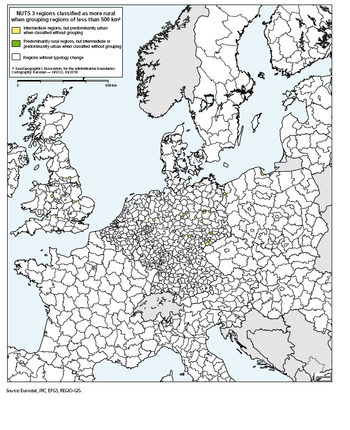
This methodology proposes a different approach to solve the problem of too small NUTS 3 regions. It combines NUTS 3 regions smaller than 500 km2 [3] with their neighbouring NUTS 3 regions. This is an approach which can uniformly be applied to all NUTS 3 regions in the EU.
Of the 1 303 NUTS 3 regions, 247 are smaller than 500 km². Some 142 were combined with their neighbours to ensure that the grouped NUTS 3 regions had a size of at least 500 km². The approach to combine them can be broken down into the followed categories.
- Forty-six small NUTS 3 regions were combined with their only neighbour.
- Fifty small NUTS 3 regions were combined with one or two neighbours with whom they shared the longest border and not with the remaining neighbouring regions.
- For 18 small NUTS 3 regions the border length did not allow a clear distinction between neighbours; in this situation they were combined with all neighbours.
- Twenty-eight small NUTS 3 regions were combined with other small NUTS 3 regions and a few main neighbours.
Of the 247 NUTS 3 regions, 105 were not grouped for the following four reasons.
- Nine are island regions and thus have no direct neighbours.
- Forty-three NUTS 3 regions have the same classification as all their neighbours and therefore combining them would not make a difference to their classification.
- Forty-one NUTS 3 regions are adjacent to a group of NUTS 3 regions with the same classification.
- For 12 Belgian NUTS 3 regions, mostly in West-Vlaanderen, there was no obvious way of grouping as most of the regions fell below the threshold. They were not grouped to maintain diversity in a region with a high overall population density.
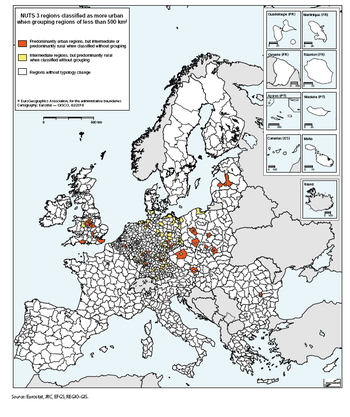
Therefore, 142 NUTS 3 regions have been grouped into 114 NUTS 3 groupings. The impact of these groupings on the classifications is shown in Maps 5 and 6.
The goal of these groupings is purely to facilitate a more comparable classification within the EU. These groupings are not used for any other purpose and are dissolved as soon as the classification has been done. As a result, the outcome is a classification for each individual NUTS 3 region.
Presence of cities
As with the OECD methodology, this new typology also considers the presence of a city in exactly the same way. The population figures are based on the census data for the year 2001 for the Urban Audit cities.
This leads to seven NUTS 3 groupings moving from predominantly rural to intermediate due to the presence of a city of over 200 000 inhabitants. This concerns: Córdoba in Spain, Maine-et-Loire, Finistère and Ille-et-Vilaine in France, Radomski in Poland, and Bihor and Dolj in Romania.
Due to the presence of a city of over 500 000 inhabitants, 16 NUTS 3 regions move from intermediate to predominantly urban. This is the case for: Praha and its surrounding region in the Czech Republic, Zaragoza, València, Málaga and Sevilla in Spain, Gironde (with Bordeaux), Haute-Garonne (with Toulouse) and Loire-Atlantique (with the communauté urbaine de Nantes) in France, and Vilnius in Lithuania. In Poland it is also the case for Kraków, Poznań and Wrocław and their surrounding region.
Comparing the OECD to the new typology
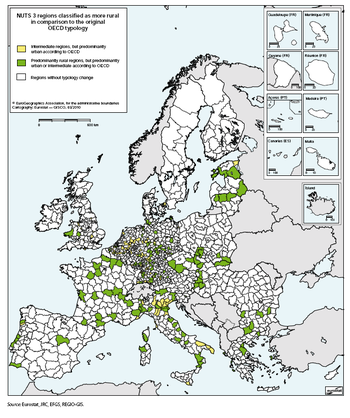
Maps 3 and 4 show the change in classification between the OECD approach applied to NUTS 3 regions and the new typology applied to the NUTS 3 groupings.
Overall, the population share in intermediate regions at the EU level does not change (see Figure 15.2). However, the share of population in predominantly rural regions increases by 4 percentage points (a relative increase of 20 %) and the share of population in predominantly urban regions drops by 4 percentage points.
At the country level, changes follow the changes at the local level, with the Netherlands and Belgium becoming less urban and Sweden and Finland becoming more intermediate and less rural. In the Baltic Member States, Slovenia, the Czech Republic and Slovakia, between 15 % and 25 % of the population shifts between categories. Also in Italy, Greece and Portugal, 17 % of the population shifts between categories.
Other regional levels
Although in principle this methodology can also be applied at higher geographical levels such as NUTS 2 or NUTS 1 regions, this chapter argues against this. An application at higher geographical levels would in some cases hide significant differences between regions behind the global average for the aggregated level. This effect is not due to the methodology per se, but is a result of the geographical level applied. It may occur for the methodology presented here as well as for the OECD methodology.
The loss of differentiated results can be shown by comparing results at NUTS 2 and NUTS 3 level based on the OECD methodology. The share of population in predominantly rural regions at NUTS 2 level is about one third lower than the share identified at NUTS 3 level. The problem is further illustrated by the fact that under the OECD methodology only half of the population in a predominantly rural NUTS 3 region lives in a predominantly rural NUTS 2 region. Moving to a classification of NUTS 2 regions would change the typology so substantially that it undermines the greater precision of results obtained through the new approach.
One of the reasons for this mixed use of classification at NUTS 2 and NUTS 3 has been the limited data availability at NUTS 3 level. Fortunately, an increasing number of indicators at NUTS 3 level is available through Eurostat. In addition, for some of the indicators only available at aggregated geographical level, small area estimation techniques can help to estimate the NUTS 3 values based on NUTS 2 data and auxiliary data at NUTS 3. However, for certain indicators these estimation techniques are not immediately available or have to be further developed.
Conclusion
This new typology successfully addresses two main constraints of the OECD methodology applied to NUTS 3 regions in the EU: the variation in surface area of LAU2 and NUTS 3 regions. It does this in a consistent manner throughout the Union in three main steps:
- It creates clusters of urban grid cells with a minimum population density of 300 inhabitants per km² and a minimum population of 5 000. All the cells outside these urban clusters are considered as rural.
- It groups NUTS 3 regions of less than 500 km² with one or more of its neighbours solely for classification purposes, i.e. all the NUTS 3 regions in a grouping are classified in the same way.
- It classifies NUTS 3 regions based on the share of population in rural grid cells. More than 50 % of the total population in rural grid cells = predominantly rural, between 20 % and 50 % in rural grid cells = intermediate (6) and less than 20 % = predominantly urban.
This new typology will be updated after every NUTS modification and after each major update of the population grid based on new census data and new land cover data. The current and future updates of this classification as well as information on which NUTS 3 regions have been grouped for classification purposes can be downloaded here (Excel file).
Acknowledgements
This typology has been developed over the past two years, jointly by the following four different European Commission Directorates-General: DG Agriculture and Rural Development, Eurostat, the Joint Research Centre (JRC) and DG Regional Policy. The authors would like to acknowledge in particular the contribution of Guido Castellano, Josefine Loriz-Hoffmann, Christine Mason, Lorenzo Orlandini, Rob Peters and Thierry Vard from the Agriculture and Rural Development DG, Berthold Feldmann and Oliver Heiden from Eurostat, Javier Gallego from the JRC, and Nicola De Michelis, Lewis Dijkstra and Hugo Poelman from the Regional Policy DG.
Further Eurostat information
Publications
- Eurostat regional yearbook 2010, chapter 15
Dedicated section
- Regions and cities, see:
- City statistics - Urban Audit
External links
- European Commission - Joint Research Centre
- European Environment Agency - Population density disaggregated with Corine land cover 2000
- European Forum for GeoStatistics
- OECD REGIONAL TYPOLOGY (pdf file, 1.93 Mb)
Source data for tables and graphs (MS Excel)
See also
- European cities
- European cities - demographic challenges
- European cities - spatial dimension (Background article)
- Urban rankings
Notes
- ↑ See OECD Regional Typology, GOV/TDPC/TI(2007)8, 2007, Paris,OECD.
- ↑ Using 20 % instead of 15 % leads to about another 70 regions to be classified as predominantly urban instead of intermediate. Two thirds of these regions are in Germany and the UK. Increasing this threshold to 25 % would lead to approximately another 50 regions to be classified as predominantly urban. Overall, using 15 % would lead to changing the classification of regions home to about 25 % of the EU population, while using 20 % only changes it for about 8 % as compared to the OECD classification.
- ↑ The threshold of 500 km² was selected to ensure that the most atypically small NUTS 3 regions would be identified. Reducing the threshold to 400 km² would reduce the number of small NUTS 3 regions by 35 and increasing the threshold to 600 km² would increase the number by 39.

