).png)
).png&body=Statistics Explained - Water exploitation index, by country, 2010 and 2015 (% of long term average available water (LTAA)).png %0A https%3A%2F%2Fec.europa.eu%2Feurostat%2Fstatistics-explained%2Findex.php%3Ftitle%3DFile%3AWater_exploitation_index%2C_by_country%2C_2010_and_2015_%28%2525_of_long_term_average_available_water_%28LTAA%29%29.png)
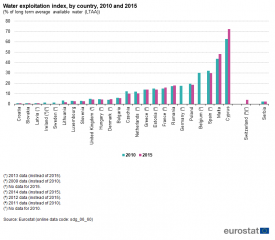
File:Water exploitation index, by country, 2010 and 2015 (% of long term average available water (LTAA)).png
Revision as of 20:50, 27 June 2019 by Nhametma (talk | contribs) (Nhametma uploaded a new version of "File:Water exploitation index, by country, 2010 and 2015 (% of long term average available water (LTAA)).png")
).png)
).png&diff=prev&oldid=439679)
).png&direction=prev&oldid=439679)

Size of this preview: 688 × 600 pixels. Other resolutions: 275 × 240 pixels | 805 × 702 pixels.
Original file (805 × 702 pixels, file size: 43 KB, MIME type: image/png)
File usage
There are no pages that use this file.
).png&oldid=439679)
).png&action=edit&redlink=1)
).png&action=history)