.jpg)
.jpg&body=Statistics Explained - Urban population exposure to air pollution by ozone, EU-27, 1999-2007 (micrograms per cubic metre day).jpg %0A https%3A%2F%2Fec.europa.eu%2Feurostat%2Fstatistics-explained%2Findex.php%3Ftitle%3DFile%3AUrban_population_exposure_to_air_pollution_by_ozone%2C_EU-27%2C_1999-2007_%28micrograms_per_cubic_metre_day%29.jpg)
File:Urban population exposure to air pollution by ozone, EU-27, 1999-2007 (micrograms per cubic metre day).jpg
Revision as of 12:25, 30 September 2010 by Chrisdh (talk | contribs) (→Most recent data available now, see:)
.jpg&diff=prev&oldid=36485)
.jpg&direction=prev&oldid=36485)
No higher resolution available.
Urban_population_exposure_to_air_pollution_by_ozone,_EU-27,_1999-2007_(micrograms_per_cubic_metre_day).jpg (648 × 240 pixels, file size: 29 KB, MIME type: image/jpeg)
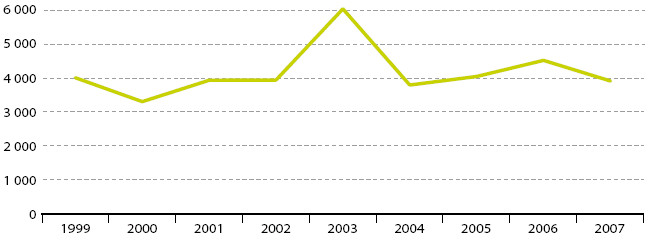
Urban population exposure to air pollution by ozone, EU-27, 1999-2007
- micrograms per cubic metre day
Graph created with data from July 2009
Most recent data available now, see:
Urban population exposure to air pollution by ozone (tsdph380)
File usage
There are no pages that use this file.
.jpg&oldid=36485)
.jpg)
.jpg&action=edit&redlink=1)
.jpg&action=history)