_Evolution_of_main_indicators,_EU-27_(2000%3D100).PNG)
 Evolution of main indicators, EU-27 (2000=100).PNG&body=Statistics Explained - Manufacture of rubber and plastic products (NACE Division 25) Evolution of main indicators, EU-27 (2000=100).PNG %0A https%3A%2F%2Fec.europa.eu%2Feurostat%2Fstatistics-explained%2Findex.php%3Ftitle%3DFile%3AManufacture_of_rubber_and_plastic_products_%28NACE_Division_25%29_Evolution_of_main_indicators%2C_EU-27_%282000%253D100%29.PNG)
File:Manufacture of rubber and plastic products (NACE Division 25) Evolution of main indicators, EU-27 (2000=100).PNG
_Evolution_of_main_indicators,_EU-27_(2000%3D100).PNG&diff=prev&oldid=53056)
_Evolution_of_main_indicators,_EU-27_(2000%3D100).PNG&direction=prev&oldid=53056)
Size of this preview: 800 × 309 pixels. Other resolutions: 320 × 124 pixels | 1,121 × 433 pixels.
Original file (1,121 × 433 pixels, file size: 32 KB, MIME type: image/png)
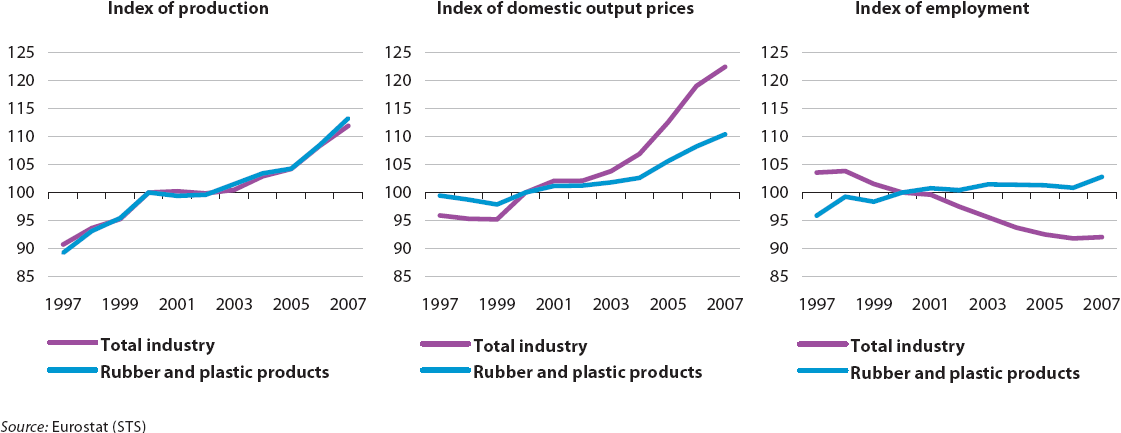
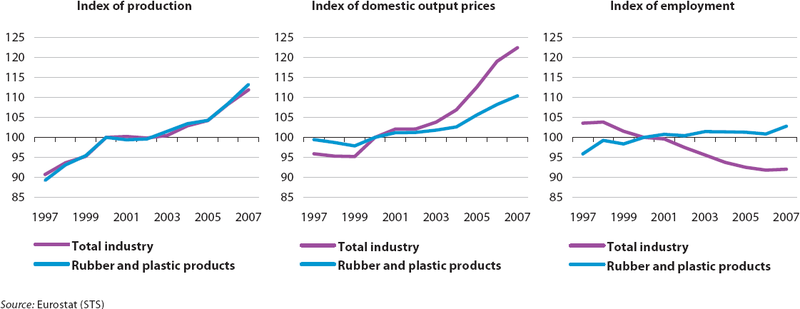
Manufacture of rubber and plastic products (NACE Division 25) Evolution of main indicators
- (2000=100)
Figure created with data from January 2009
File usage
The following page uses this file:
_Evolution_of_main_indicators,_EU-27_(2000%3D100).PNG&oldid=53056)
_Evolution_of_main_indicators,_EU-27_(2000%3D100).PNG)
_Evolution_of_main_indicators,_EU-27_(2000%3D100).PNG&action=edit&redlink=1)
_Evolution_of_main_indicators,_EU-27_(2000%3D100).PNG&action=history)