Archive:Sustainable development - good governance
- Data from July 2009, most recent data: Further Eurostat information, Database.
This article provides an overview of statistical data on sustainable development in the areas of good governance. They are based on the set of sustainable development indicators the European Union agreed upon for monitoring its Sustainable development - Good Governance Sustainable development strategy. Together with similar indicators for other areas, they make up the report 'Sustainable development in the European Union - 2009 monitoring report of the EU sustainable development strategy', which Eurostat draws up every two years to provide an objective statistical picture of progress towards the goals and objectives set by the EU sustainable development strategy and which underpins the European Commission’s report on its implementation. More detailed information on good governance indicators, such as indicator relevance, definitions, methodological notes, background and potential linkages, can be found on page 259-277 of abovementioned publication.
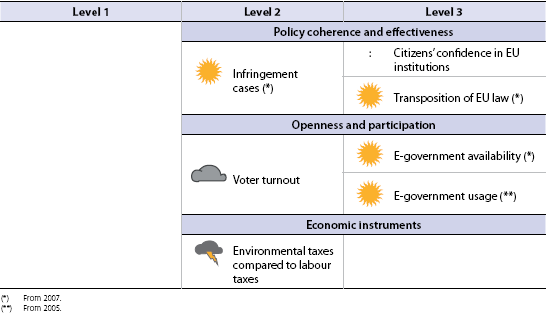
The table below summarizes the state of affairs of in the area of good governance. Quantitative rules applied consistently across indicators, and visualized through weather symbols, provide a relative assessment of whether Europe is moving in the right direction, and at a sufficient pace, given the objectives and targets defined in the strategy.
Overview of main changes
The trends observed in the good governance theme since 2000 have been mixed. While there have been positive trends in e-government availability and usage as well as in the transposition of Community law, there have been negative trends in the number of new infringement cases brought before the European Court of Justice. Voter turnout in national parliamentary elections has fallen and is still lower for the EU Parliament. Moreover, the ratio of environmental to labour taxes has decreased and thus, a general shift towards a higher share of environmental taxes in total tax revenues has not been achieved.
Main statistical findings
Headline indicators
Policy coherence and effectiveness
Citizens' confidence in EU institutions
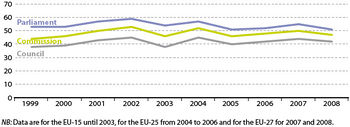
The European Parliament is the most trusted among the EU institutions, followed by the European Commission and the Council of the European Union. The trust levels for these main EU institutions in the EU-27 were lower in 2008 than in 2007
This indicator expresses the level of confidence (or trust) that citizens have in the three main EU institutions: Council of the European Union, European Parliament, and European Commission.
More than half of citizens asked trust the European Parliament
In 2008, slightly more than half of EU-27 citizens said that they trusted the European Parliament (51 %), making it the most trusted among the main EU institutions. Fewer citizens said that they trusted the European Commission (47 %) and the Council of the EU (42 %). The trust levels in 2008 have decreased in the EU-27 compared to the levels in 2007: a drop of four percentage points for the European Parliament, three percentage points for the Commission, and two percentage points for the Council.
Confidence develops in parallel for EU institutions over time
Confidence in the three main EU institutions has mostly developed in parallel over time. Based on 2007 values, the levels of confidence correspond to the degree of public awareness of these EU institutions. Public awareness has been highest for the European Parliament (partly due to citizens’ participation in the European elections), followed by the Commission and the Council (10).
Infringement cases
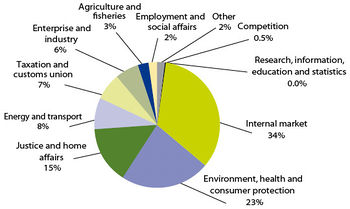
The number of infringement cases in the EU-25 has increased from 170 to 207 between 2005 and 2008. The situation among policy areas varies, and just three predominate
72% of cases concern internal market, environment, health and consumer protection, and justice and home affairs

Between 2005 and 2008, the number of infringement cases in the EU-25 increased by an annual average growth rate of 6.8 %. However, the number of cases varied substantially from one year to the next. In 2008, 207 cases, where a Member State had failed to fulfil its obligations, were brought before the European Court of Justice. This marks a slight decrease compared to 2007 with 212 cases.
The situation varies considerably between the different policy areas and three areas in particular have predominated: internal market; environment, health and consumer protection; and justice and home affairs. In 2008, these three areas out of eleven made up 72 % of all actions for failure. 71 actions were linked to the internal market, 49 actions to environment, health and consumer protection, and 31 actions to justice and home affairs.
Transposition of Community law
The implementation of Community law into national law has slightly increased in the EU-25 between 2004 and 2008. The transposition level has been above or almost on the target rate since 2005, but has remained below in several policy sectors

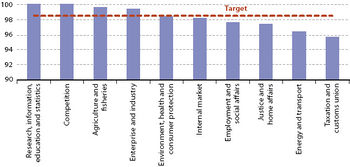
Transposition of Community law was right on target in EU-27 in 2008
The indicator measures the percentage of EU directives for which measures of implementation in national law have been undertaken. In 2001, the European Council set the target of a 98.5 % rate of transposition of Community law by national authorities. Between 2004 and 2008, the share of implemented directives in the EU-25 increased on average by 0.15 percentage points per year. Between 2007 and 2008, the transposition level decreased in the EU-27 from 99.3 % to 98.5 %, but has remained right on target.
Six out of ten policy sectors have been below target
All policy sectors have now reached transposition rates above 95 % and these rates have increased since 2004, with the exception of energy and transport, and taxation and customs union. In 2008, the transposition levels were below the Community-wide target of 98.5 % in six sectors.
Openness and participation
Voter turnout
Participation in national parliamentary elections in the EU-27 has decreased between 2000 and 2008. However, the turnout has been generally higher than in EU elections
Voter turnout in national parliamentary elections has decreased
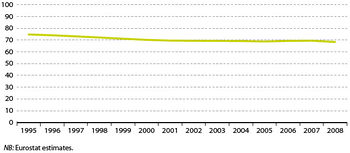
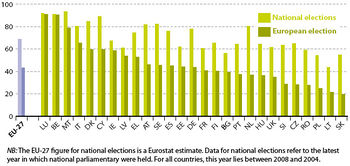
When comparing the voter turnout in national parliamentary elections in the EU-27 between 2000 and 2008, participation has slightly decreased by an annual average rate of 0.3 % from 70.3 % to 68.5 %. It has decreased in most Member States during this time period, but has remained above 50 % in all countries except for one.
Participation in EU elections has been considerably poorer than in national elections
Participation in EU parliamentary elections has been considerably lower than in national elections. In 2009, voter turnout in the EU elections has been 43 % and has thus been lower than in the previous elections in 2004 with 45.5 % and 1999 with 49.5 %. Looking at the results for the 2009 EU election in the individual Member States, turnout remained below 50 % in 18 countries, and was above 50 % in nine countries. The poorer voting record for the EU parliament than for national parliaments – more than 20 % less in 18 countries – may reflect a lack of information on EU matters among EU citizens (12) as well as the fact that EU elections may not be perceived by citizens as having much impact on national (and personal) interests.
E-government availability
The offer of on-line public services has steadily increased in the EU-25 since 2004, reaching 62% in 2007. It varies however considerably among Member States
The on-line availability of public services in the EU is 59%
[[Image:E-government online availability (%).jpg|thumb|right|350px|Graph 8: E-government online availability (%) - Source: [1]. {Stable linke .......
Energy
Energy dependency
EU-27 energy dependency has risen steeply since 2000 and the level of around 55 % in 2008 is significantly higher than during the 1990s
More than half of EU energy is imported
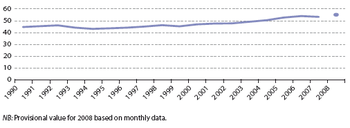
Energy dependency shows the extent to which an economy relies upon imports in order to meet its energy needs. Despite annual fluctuations, EU-27 dependency on imported energy remained rather constant throughout the 1990s, at a level of around 45 %. Since 2000, however, the level of dependency has grown, exceeding 50 % in 2004 and reaching a level of about 55 % (based on provisional data) in 2008. This represents a degree of dependence 10 percentage points higher than the average of the previous decade.
Apart from the growing demand for energy, the larger share of natural gas which is imported from outside the European Union and declining oil reserves in the North Sea have contributed to this development.
Gross inland energy consumption
The EU’s energy demand has grown moderately. Between 2000 and 2007 EU-27 energy consumption grew faster than in the previous decade, although since 2003 it has levelled off . There has been a general shift away from solid fuels towards natural gas and to some extent renewable energies
Energy consumption has grown since 2000 but has shown signs of stabilising over recent years. An overall shift away from solid fuels towards natural gas and renewable energies has taken place
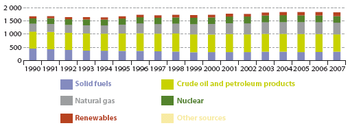
Gross inland energy consumption presented an average annual growth of 0.7 % between 2000 and 2007, slightly higher than the rate of 0.4 % in the previous decade. However, since 2003 energy consumption has levelled off . Overall, there has been a shift away from solid fuels, which represented about 27 % of the total consumption in 1990 and only about 18 % in 2007. This shift has been predominantly in favour of natural gas, rising from 18 % to 24 % over the same period, and, to a lesser extent, nuclear energy (rising from 12 % to 13 %) and renewable energies (rising from 4 % to 8 %). The share of crude oil and petroleum products decreased slightly from 38 % in 1990 to 36 % in 2007.
The rise in energy demand of about 80 million tonnes of oil equivalent between 2000 and 2007 mainly involved an increase of about 40 million tonnes of oil equivalent of both natural gas and renewable energies. While solid fuels also increased by about 10 million tonnes of oil equivalent, this was compensated by a decrease in crude oil and petroleum products, and nuclear energy.
Electricity generation from renewables
The share of renewables in electricity production increased from 13.8 % in 2000 to 15.6 % in 2007 in the EU-27, but remains below the path to the 2010 target of 21 %
Capacity of renewable electricity generation needs to speed up to meet 2010 target

Between 2000 and 2007, the contribution of electricity from biomass, hydro, wind, geothermal and solar energy increased progressively, reaching 15.6 % in 2007. After a decline during the early years of the decade, the annual growth rate is now substantially higher than during the 1990s. Between 2006 and 2007 the share of renewables grew by 1.0 percentage point. However, reaching the 21 % share by 2010 would require almost double of this rate.
Relatively long lead times for power generation investments may partially explain the previous slow progress. Prices for renewable energies, which for some technologies remain higher than conventional power generation, may also contribute to limit the speed of growth. In addition, regulatory barriers, such as difficulties in obtaining planning permission or grid access, persist in many Member States (see Commission communication Renewable energy road map. Renewable energies in the 21st century: Building a more sustainable future, COM(2006) 848).
Consumption of biofuels in transport
Biofuels are a small but rapidly growing energy source for transport. Their consumption has shown accelerated growth since 2000 and reached a share of 2.6 % in 2007 in EU-27. However, despite this growth their share remains below the target path
If growth in biofuels continues, the targets will probably be met

Between 1990 and 2000 the EU-27 share of biofuels in the petrol and diesel consumption of transport increased from zero to 0.24 %. From 2000 to 2007 the growth rate has increased leading to a share of 2.6 % in 2007.
Even though in 2007 the share of biofuels remains well below the target path, the current rate of growth would be sufficient to reach the 5.75 % target by 2010 as well as the binding 10 % target by 2020.
Combined heat and power
The uptake of combined heat and power, or cogeneration, has increased between 2004 and 2007, reaching 10.9 % of gross electricity generation in the EU-27
Combined heat and power generation has increased moderately since 2004

Despite the small decrease in 2006, the share of combined heat and power in total EU-27 electricity generation rose by 0.4 percentage points between 2004 and 2007 to 10.9 %. Although a longer time series for EU-15 is also shown in Graph 17, these data should be treated with caution due to changes in the calculation methodology over time.
According to the Energy Efficiency Action Plan, several barriers prevent expansion of capacity. These include the lack of district heating networks in many areas.
Implicit tax rate on energy
The implicit tax rate on energy fell by about 4 % between 2000 and 2007. Although this decrease in the effective tax burden on energy is inconsistent with the EU objective to shift taxation from labour onto resource and energy use, there are also indications that taxation may have stimulated energy saving
The implicit tax rate on energy has fallen since 2000

The ratio of energy tax revenues to final energy consumption represents the effective tax burden on energy. The decreases in the implicit tax rate show a decline in the effective tax burden on energy relative to the potentially taxable base. Th is is not consistent with the Sustainable Development Strategy’s principle of shifting taxation from labour onto resource and energy consumption. Nevertheless, there is some evidence that the previously high energy taxation has stimulated improvements in energy efficiency and has therefore helped to conserve energy. There has also been a greater reliance on policy instruments other than taxes, such as emissions trading. It is also true that energy taxes were reduced to compensate for the substantial rise in the oil price over recent years (see Taxation trends in the European Union, pp. 123-4).
Further Eurostat information
Publications
- Sustainable development in the European Union - 2009 monitoring report of the EU sustainable development strategy
- Energy, transport and environment indicators - Pocketbook, 2009
- Panorama of energy: Energy statistics to support EU policies and solutions - Statistical book, 2009
Database
- Indicators
- Climate Change and Energy
Dedicated section
Other information
- Commission communication, Promotion of the use of energy from renewable sources (Renewable Energy Directive), COM(2009) 28
- Commission communication, 20 20 by 2020: Europe’s climate change opportunity, COM(2008) 30
- Commission communication, An energy policy for Europe, COM(2007) 1
- Commission communication Energy efficiency: delivering the 20 % target, COM(2008) 772
- Commission Staff Working Document, The renewable energy progress report, SEC(2009) 503
- Green Paper - A European Strategy for Sustainable, Competitive and Secure Energy, European Commission, COM/2006/0105 final
- White paper - Adapting to climate change : towards a European framework for action, European Commission, COM/2009/0147 final
- Energy and environment report 2008, European Environment Agency, Report No 6/2008
- Greenhouse gas emission trends and projections in Europe 2008: Tracking progress towards Kyoto targets, European Environment Agency, Report No 5/2008
- International Energy Agency, World energy outlook 2009, IEA, Paris, 2009, in press
- Pachauri, R.K and Reisinger, A. (eds.), Climate Change 2007: Synthesis Report. Contribution of Working Groups I, II and III to the Fourth Assessment Report of the Intergovernmental Panel on Climate Change, IPCC, Geneva, 2007
- Rummukainen, M. and Källén, E., New climate science 2006-2009. A brief review of research into the physical science basis of the climate change issue since IPCC AR4/WG I of 2007, The Commission on Sustainable Development, Stockholm, 2009
- Stern, N.H., The economics of climate change: the Stern review, Cambridge University Press, Cambridge, 2007*Directive 2009/28/EC of 23 April 2009on the promotion of the use of energy from renewable sources(Renewable Energy Directive)
External links
See also
Notes
- ↑ Eurostat
