Archive:Social protection statistics - main indicators
- Data from July 2016. Most recent data: Further Eurostat information, Main tables and Database. Planned article update: June 2018.
Social protection systems are highly developed in the European Union (EU): they are designed to protect people against the risks associated with unemployment, parental responsibilities, health care and invalidity, the loss of a spouse or parent, old age, housing and social exclusion.
This article examines differences in EU Member States' social protection expenditure, expressed among other things as a percentage of GDP and on a per-capita basis.
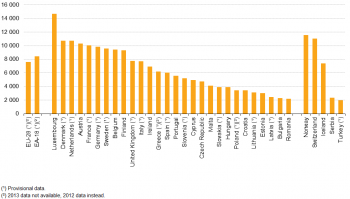
(PPS per capita)
Source: Eurostat (spr_exp_sum)
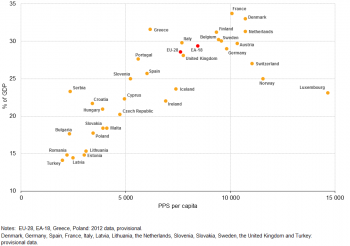
(percentage of GDP and PPS per capita)
Source: Eurostat (spr_exp_sum)
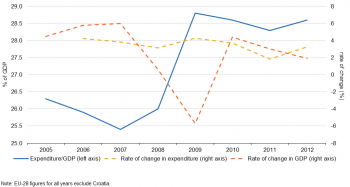
(% of GDP and rates of change in expenditure and GDP)
Source: Eurostat (spr_exp_sum) and (nama_10_gdp)
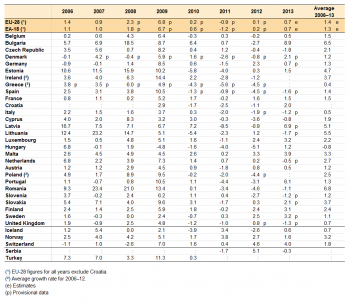
(% change compared with the previous year)
Source: Eurostat (spr_exp_sum)
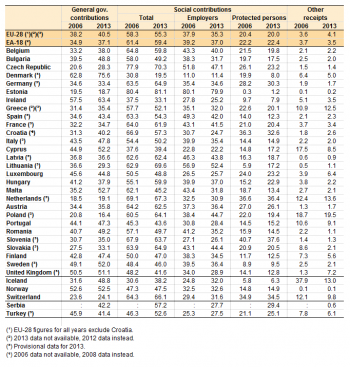
(% of total receipts)
Source: Eurostat (spr_rec_sumt)
Main statistical findings
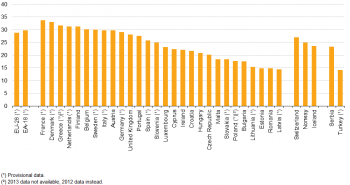
In 2013, gross expenditure on social protection accounted for 28.8 % of GDP in the EU-28 and 29.8 % in the EA-18 (see Figure 1). There are significant differences between countries in the level of expenditure on social protection. France (33.7 %), Denmark (33.0 %) and Greece (31.6 %, 2012 data) spent a large proportion of their GDP on social protection; Latvia (14.4 %), Estonia and Romania (both 14.8 %) were the Member States with the lowest ratios between social protection expenditure and GDP.
Social protection benefits are the largest component of total gross social protection expenditure. In 2012 they represented 27.5 % of GDP in the EU-28. Among them, old-age and survivors benefits predominated, representing 12.6 % of GDP. Between 2011 and 2012, in the EU-28 expenditure on social protection as a percentage of GDP rose by 0.3 percentage points (pp). This was the result of a larger rate of growth for social protection expenditure (in nominal terms) than the growth rate of GDP.
Over the period 2006–12, social protection benefits in the EU-28 grew in real terms by 1.8 % per year on average; unemployment (+ 2.5 % per year) and old age (+ 2.3 %) were the functions that grew most on average. The financing of social protection in the EU-28 in 2012 favoured social security contributions (55.3 % of total receipts) over general government funding (40.5 % of total receipts).
Per capita expenditure on social protection (in PPS)
In order to compare per capita social protection expenditure across the EU, figures are expressed in terms of purchasing power standards (PPS). In 2012, per capita social protection expenditure was 7 618 PPS in the EU-28 and 8 440 PPS in the EA-18 (see Figure 2). As for expenditure as a percentage of GDP (Figure 1), there were also pronounced differences between countries in expenditure per capita. Of all the EU Member States, Luxembourg had the highest expenditure in 2013 (14 662 PPS per capita), followed by Denmark, the Netherlands, Austria and France (with more than 10 000 PPS per capita). In this group of countries (Luxembourg excluded) per capita expenditure was roughly four to five times the value registered in the group of EU countries with the lowest expenditure, i.e. Romania, Bulgaria and Latvia (2 205, 2 318 and 2 483 PPS per capita). Of the countries outside the EU-28, expenditure was highest in Norway (11 558 PPS), surpassed only by Luxembourg. Differences between countries in terms of the level of expenditure are partly related to differing levels of wealth, but they also reflect diversity in social protection systems, demographic trends, unemployment rates and other social, institutional and economic factors.
Per capita expenditure on social protection (in PPS) and expenditure as percentage of GDP
There is a positive correlation between the expenditure on social protection expressed as a percentage of GDP and in PPS per capita (see Figure 3). In general, the relative position of a country with respect to the European aggregates is maintained with both variables. The main exceptions within the EU were Luxembourg (higher level in terms of PPS) and Greece (higher level in terms of % of GDP).
The level of expenditure per person was relatively homogeneous within the group of countries (Latvia, Estonia, Romania, Lithuania, Bulgaria, Poland, Slovakia and Malta) having the lowest levels of GDP devoted to social protection (the countries below the level of 18.4 % in the graph). Variation in expenditure per person (expressed in PPS) was also rather small within the group (Germany, Austria, Italy, Sweden, Belgium, Finland, the Netherlands, Greece, Denmark and France) with the highest levels of GDP dedicated to social protection (the countries above the line at 28.6 %, which is the value for the EU-28), with the exception of Italy and Greece which had considerably lower levels of expenditure per person. Nevertheless, the level of expenditure per person (expressed in PPS) showed greater variation in the case of countries that tended to have a low-to-medium level of expenditure as a percentage of GDP directed to social protection (between 18.4 % and 28.6 %). In this third group, even though the countries had a similar level of expenditure in terms of GDP, their levels of per capita expenditure (expressed in PPS) showed bigger differences than in the previous two groups (horizontal reading of Figure 3). The relative position of countries in this group should be considered in the light of different combinations of total levels of expenditure on social protection and per capita GDP.
Social protection expenditure compared with rate of change of GDP and expenditure
As Figure 4 shows, the shrink in social protection expenditure as a percentage of GDP until 2007 for the EU-28 was due to the fact that nominal GDP had risen faster than nominal expenditure. In 2008 GDP growth slowed down and the next year GDP contracted considerably as a result of the global financial and economic crisis. At the same time, social protection expenditure recorded a relatively stable growth, which led to a sharp increase in the social protection expenditure expressed as a percentage of GDP. The EU-28’s GDP recovered in 2010 and continued expanding in the following years, albeit at a progressively slower pace. In 2010 and 2011, social protection expenditure as a percentage of GDP slightly decreased as the growth in nominal GDP was faster than in nominal expenditure, while in 2012 the GDP growth was overtaken by the increasing growth rate of expenditure.
Evolution of social protection expenditure as percentage of GDP
In the EU-28 and euro area (EA-18), expenditure on social protection as a percentage of GDP decreased in 2007 compared with the previous year (see Table 1). In the following two years, the ratio increased by 3.4 pp in the EU-28 (3.5 pp in the EA-18), which is mainly attributable to a contraction of GDP during the global financial and economic crisis. In 2010 and 2011 the ratio decreased by 0.5 pp (0.4 pp in the EA-18) before it went up again the following two years; in the EU-28 it reached the same highest level of 2009, while in the euro area it exceeded this level.
In 2006, expenditure on social protection as a percentage of GDP in the EU-28 was 0.4 pp lower than in the EA-18. The gap widened steadily over time to 0.6 pp in 2011 and in 2013 (estimated data) this divergence reached 1.0 pp. The difference throughout the whole period can be attributed to the fact that the EU-28 includes a number of non-euro countries with low values for the ratio; in most cases these are countries that continued to show strong GDP growth during that period (i.e. Bulgaria, the Czech Republic, Lithuania, Poland and Romania).
Growth of per capita expenditure at constant prices
When the time series for the EU-28 and EA-18 are expressed in terms of per capita expenditure in euros at constant prices, an increase is observed over the whole period under review, year 2011 being the only exception. Table 2 shows the rates of growth over the period 2006–13.
Between 2006 and 2013, per capita expenditure on social protection at constant prices rose in the EU-28 at an average annual rate of 1.4 %. The average calculated over the same period in the EA-18 was slightly lower (1.3 %).
The yearly average rate of change for the EU-28 is highly influenced by changes in Germany, France, the United Kingdom and Italy, since these four countries together account for two thirds of the EU total expenditure on social protection. Among them, Italy recorded the lowest average growth rate (0.5 %) over the period 2006–13, while the highest average growth rate was observed in France (1.5 %).
Different systems of financing
In 2012, the main sources of funding of social protection at EU-28 level (see Table 3) were social contributions, which accounted for 55.3 % of all receipts, and general government contributions from taxes (40.5 %). Social contributions can be broken down into contributions paid by the protected persons (employees, self-employed persons, retired persons and others) and those paid by employers.
The European average masks major national differences in the structure of social protection funding. In Estonia and the Czech Republic, more than 70 % of all receipts were funded by social contributions. Denmark and Ireland, on the other hand, financed their social protection systems largely from taxes, which accounted for over 60 % of total receipts. Malta, Cyprus, Sweden and the United Kingdom were also heavily dependent on general government funding (over 50 %).
The share of ‘other receipts’ (including property income) was low in 2012: 4.1 % for the EU-28. However, the share in Poland, the Netherlands and Greece was well over 10 %.
These differences are historical and stem from the institutional rationales underpinning social protection systems. Northern European countries, where government funding predominates, are steeped in the ‘Beveridgian’ tradition (where it is sufficient to be a resident in need in order to be eligible for social benefits). Other countries are strongly attached to the ‘Bismarckian’ tradition, which is based on the insurance concept (in the form of contributions).
Nevertheless, in some countries the structure changed over time (relative to the year 2006) and following different patterns. Malta, Denmark, Bulgaria, Croatia, Spain and Romania have substantially increased their share of government funding. Normally this is combined with a reduction in social contributions; in Denmark and Romania, it has also been associated with a significant reduction in ‘other receipts’. A considerable change in favour of social contributions as against government contributions has been observed in Lithuania, Hungary and Poland. The share of ‘other receipts’ increased by 0.5 pp in the EU-28 and it remained more or less stable in most EU countries. The highest decreases in ‘other receipts’ were registered in Cyprus and Slovakia where they were mainly replaced by funding from tax revenue. On the other hand, an increase in ‘other receipts’ in the United Kingdom compensated a loss of funding from social contributions.
Data sources and availability
Figures are collected from national statistical institutes or/and ministries of social affairs. Most of the data are compiled from administrative sources.
For more detailed information, please refer to the:
- Consolidated quality reports on social protection statistics.
- Qualitative information.
- National quality reports on Core System.
Data for 2013 are not available for some EU member states yet. As a consequence, 2012 figures are used for these countries as well as for the EU-28 aggregate.
For Greece some data related to recent years are provisional. In addition, ELSTAT has indicated that a significant revision of their ESSPROS schemes, methodology and relevant data is on-going, which might affect the complete time series from 2000 onwards.
Context
The European system of integrated social protection statistics was jointly developed in the late 1970s by Eurostat and representatives of EU Member States in response to the need for a specific instrument for statistical observation of social protection in the EC Member States.
ESSPROS is a common framework allowing international comparison of the administrative national data on social protection. It provides a coherent comparison between European countries of social benefits to households and their financing.
ESSPROS is composed of the core system and of modules. The core system contains annual data (starting from the year 1990) collected by Eurostat on:
- Quantitative data: social protection receipts and expenditures by schemes (a distinct body of rules, supported by one or more institutional units, governing the provision of social protection benefits and their financing);
- Qualitative database:: metadata by scheme and detailed benefit.
The receipts of social protection schemes are classified by type and origin. The type gives the nature of, or the reason for a payment: social contributions, general government contributions, transfers from other schemes and other receipts; the origin specifies the institutional sector from which the payment is received: all resident institutional units (corporations, general government, households, non-profit institutions serving households) and the rest of the world.
The expenditure of social protection is classified by type, indicating the nature of, or the reason for, the expenditure: social protection benefits, administration costs, transfers to other schemes and other expenditure. Social protection benefits are transfers to households, in cash or in kind, intended to relieve them from the financial burden of a number of risks or needs. The risks or needs of social protection included in ESSPROS are disability, sickness/healthcare, old age, survivors, family/children, unemployment, as well as housing and social exclusion not elsewhere classified.
The modules contain supplementary statistical information on particular aspects of social protection: they relate to the number of beneficiaries of social protection pensions and to net social protection benefits.
See also
- Social protection statistics - financing
- Social protection statistics - social benefits
- Social protection statistics
- Social protection statistics - net expenditure on benefits
- Social protection statistics - pension expenditure and pension beneficiaries
Further Eurostat information
Publications
- European social statistics — Social protection expenditure and receipts — Data 1997–2005
- Statistics in focus 14/2012 — In 2009, a 6.5 % rise in per capita social protection expenditure matched a 6.1 % drop in EU GDP
- News release on social protection released on 27 November 2012: EU-27 spent 29.4 % of GDP on social protection in 2010
- News release on social protection released on 21 November 2013: EU-28 spent 29.1 % of GDP on social protection in 2011
Main tables
Database
- Social protection, see:
- Social protection expenditure (spr_expend)
- Social protection receipts (spr_receipts)
- Pensions beneficiaries (spr_pension)
- Net social protection benefits (spr_net_ben)
Dedicated section
Methodology / Metadata
- Social protection (ESMS metadata file — spr_esms)
- ESSPROS Manual
Source data for tables and figures (MS Excel)
Other information
- Regulation (EC) No 458/2007 of 25 April 2007 on the European system of integrated social protection statistics (ESSPROS)
- Regulation (EC) No 1322/2007 of 12 November 2007 implementing Regulation (EC) No 458/2007 as regards the appropriate formats for transmission, results to be transmitted and criteria for measuring quality for the ESSPROS core system and the module on pension beneficiaries
- Regulation (EC) No 10/2008 of 8 January 2008 implementing Regulation (EC) No 458/2007 as regards the definitions, detailed classifications and updating of the rules for dissemination for the ESSPROS core system and the module on pension beneficiaries
