Archive:Statistics on employment characteristics of households
- Data extracted in June 2016. Most recent data: Further Eurostat information, Main tables and Database.
European Union Labour force survey - Annual results 2015
This article presents some of the main results for 2015 of the EU Labour force survey (LFS) for the European Union (EU) as a whole, for all Member States individually, as well as for two candidate countries and three EFTA countries.
The topics of this article are:
- employees
- self-employed persons
- part-time employment
- employees with limited duration contracts
- foreign workers
- the size of the principal population groups in the labour force survey, and how they relate to one another
This article should be read together with the articles Employment rates and Europe 2020 national targets and Underemployment and potential additional labour force statistics, for a more complete picture of the situation on the labour market in 2015.
Main statistical findings
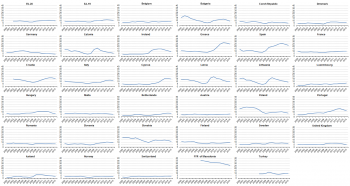
In 2015, the EU unemployment rate continued to fall, to 9.4 %, and was at its lowest since 2010. This was the second year in a row with a markedly diminished rate. The crisis which started in the end of 2008 peaked in the beginning of 2013. There are, however, large differences between the countries; some have returned to or even improved on their pre-crisis levels, others have stabilised at much higher rates, and yet others show little or no effects from the crisis (see Figure 1).
There are also improvements in the employment rate, which stood at 70.1 % in 2015. This is the second best annual result since the start of the data series in 1995. For more results on the employment rate, see the article Employment rates and Europe 2020 national targets.
Unemployment
The situation in 2015
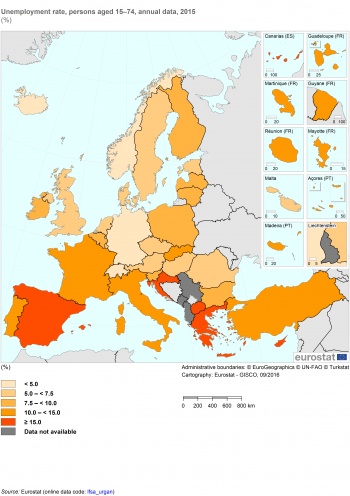
The EU annual average unemployment rate was 9.4 % in 2015, and 10.9 in the Euro-area. For the EU Member States the levels ranged from 4.6 % in Germany to 24.9 % in Greece. For the non-member states covered by this data set there were even larger differences, from 4.0 % in Iceland to 26.1 % in the Former Yugoslav Republic of Macedonia.
Map 1 shows the situation for all countries in 2015: Germany clearly stands out as the Member State with the lowest unemployment, joined by the non-member states Iceland, Norway, and Switzerland. The following group (5.0 - 7.4 %) contains the United Kingdom as the largest economy, and also includes a continuous corridor of the Czech Republic, Austria, Hungary, and Romania on one side, a Scandinavian / Baltic cluster of Sweden, Denmark, and Estonia on another, as well as the Netherlands and Luxembourg. Four of the eight countries having unemployment from 7.5 - 9.9 % form a north-eastern group, from Poland through most of the Baltic, and into Finland. Joining them, in a more scattered fashion, are Belgium, Slovenia, Bulgaria, and Ireland. France and Italy form the core of the 10.0 - 14.9 % group, which also includes Slovakia, Portugal, and Turkey. The highest unemployment levels were recorded in Cyprus, Croatia, Spain, Greece, and the Former Yugoslav Republic of Macedonia.
Development over the period 2000 - 2015
Looking at the development over time (Figure 1) rather than at a snap shot of 2015, comparing 2000 to 2015, it is clear that four Member States (France, Hungary, Romania, United Kingdom) have had a rather stable unemployment rate. Another ten (Bulgaria, Czech Republic, Germany, Estonia, Latvia, Lithuania, Malta, Poland, Slovakia, Finland) have shown clear improvements over this period. The remaining sixteen countries analysed in this article are worse off in 2015 than they were in 2000.
Narrowing the perspective a bit, to the years of 2007-13, there are four countries which even managed to decrease their unemployment rate during the crisis: Germany, Malta, the Former Yugoslav Republic of Macedonia, and Turkey. In addition, six countries experienced an increase in unemployment of less than one percentage point (Belgium, Austria, Poland, Romania, Norway, Switzerland). By contrast, eleven countries had increases of five percentage points or more, two of which had increases of more than 15 percentage points (Greece and Spain).
On average for the EU, the crest of the most recent unemployment wave broke in late 2013, and has continued to recede in 2014 and 2015. It varies, however, not less than eight years between the individual countries on when they had their highest unemployment level after the crisis (Germany and Turkey in 2007. France, Luxembourg, Austria, Finland and Norway in 2015).
Long-term unemployment
Combating long-term unemployment is a high priority goal, as being unemployed for more than a year has negative consequences both for the unemployed persons, as it is linked closely to poverty and to a decreasing chance of finding a job, and a negative impact on public finances, and on the EU 2020 policy goal of increased employment.
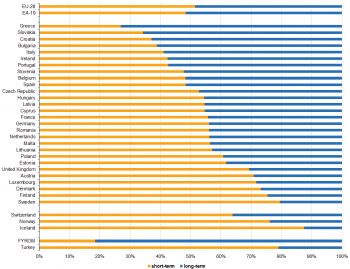
In 2015, practically half of those who were unemployed in the EU (48.5 %) were long-term unemployed. For the Euro-area the number was 51.6. Looking at figure 2, it is evident that the United Kingdom, Austria, Luxembourg, Denmark, Finland, Sweden, Norway, Iceland and Turkey had less than a third of their unemployed being long-term unemployed, whereas Greece, Slovakia and the Former Yugoslav Republic of Macedonia were in the opposite situation, with more than two thirds of the unemployed being long-term.
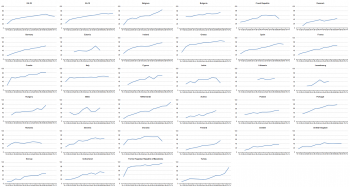
A distribution of the data on five year age groups (Figure 3) clearly shows that the occurrence of long-term unemployment increases with increased age. The degree of the correlation varies between the countries (compare for instance the Netherlands to Italy), but the general trend is very clear.
Youth unemployment
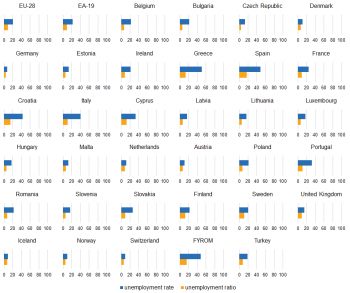
Regarding youth unemployment, a very common misunderstanding is to think that a 40 % youth unemployment rate means that 40 % of all persons aged 15-24 are unemployed. This is incorrect because the youth unemployment rate is defined as the number of unemployed persons aged 15–24 divided by the economically active population for the same age group. A large proportion of persons 15-24 are in education, i.e., not economically active, as opposed to older persons, who for the most part are not in education any longer, and to a large extent have a job. The unemployment rate is calculated in the same way regardless of the age group, but this misunderstanding has a larger effect when looking at the younger age groups, for the reason just mentioned.[1] This is why Figure 4 contains both the unemployment rate and the unemployment ratio
Figure 4 shows that the youth unemployment rate is at a two digit level in all Member States, except Germany. The lower end of the scale (10.0 to 14.9 %) includes the Czech Republic, Denmark, Estonia, Malta, the Netherlands, Austria, and the United Kingdom. In contrast, Greece, Spain, Croatia, and Italy have the highest rates. This is a pattern which closely resembles the overall unemployment rate, as seen in Map 1, but the rates are higher for younger persons than for the total averages. Seen together with Figure 3 this shows that young persons are more exposed to unemployment than older persons, but the situation is the opposite regarding the length of the unemployment spell.
Considering instead the unemployment ratio, a part of the differences between the countries disappears. Whereas the highest unemployment rate (Greece, 49.8 %) is almost 7 times higher than the lowest unemployment rate (Germany, 7.2 %), this measurement shrinks to slightly above four times for the unemployment ratio (16.8 % for Spain and 4.1 % for the Czech Republic).
Employees
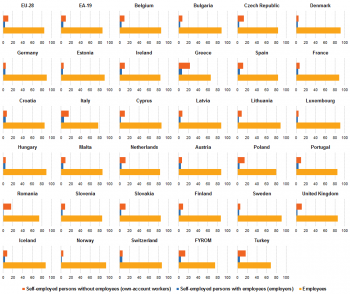
A vast majority of persons who work are employees. For the average of the EU-28 this number stands at 84.6 % (Figure 5). Some differences do exist across the countries, but the general pattern holds for all of them: employees outnumber self-employed by a wide margin everywhere. Only in three countries is the proportion of employees below 75 % (Greece, Romania and Turkey). Five countries have more than nine out of ten working persons as employees (Denmark, Estonia, Luxembourg, Sweden and Norway).
Employees working part-time
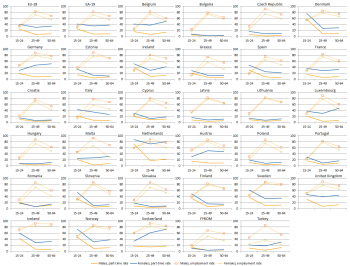
Figure 6 shows that part-time employment has a marked correlation with gender, and also some correlation with age: in all but three cases (young persons (15-24) in Romania, middle aged persons (25-49) in Romania, and young persons in the Former Yugoslav Republic of Macedonia) women are more likely to work part-time than men. When looking at the EU-28 average, for the youngest persons (15-24), women are 1.6 times more likely as men to work part-time. This increases to 4.5 times for the middle aged group (25-49), and falls somewhat for the oldest group (50-64), down to 3.9 times.
Looking only at age, the most prevalent situation is that part-time is used most among younger persons (15-24), decreases for the middle age groups (25-49), and the rises slightly again for the oldest group (50-64). However, there are notable differences among the countries: Denmark shows a large drop in part-time workers between youngest and the middle age group, for both men and women, while Germany has a steady increase throughout for women, and a decrease for men.
Concerning levels, the Netherlands and Bulgaria are the extreme cases: a large majority of Dutch women work part-time, no matter their age, while part-time work is almost non-existent in Bulgaria, for both genders.
The other element in the chart, the employment rate, shows that a high employment rate for young persons and a high use of part-time work for young persons appear at the same time in Denmark, the Netherlands, Iceland, Norway and Switzerland, but the same pattern is not apparent (that is, either high employment rate or high use of part-time work, but not both at the same time) in Ireland, Austria, Slovenia and the United Kingdom.
A high employment rate (defined as higher than the EU-28 average) for young men correlates with a high employment rate for older men in 12 countries (high rates both for the young and the older), whereas it does not correlate particularly well in 10 other countries (high rates either for the young or the older, but not for both at the same time). For women correlation is observed in 11 countries and no correlation in 12 countries. The remaining countries have low employment rates throughout the age groups.
See also the Underemployment and potential additional labour force statistics for a further analysis of persons who involuntarily work part-time.
Persons with time limited contracts
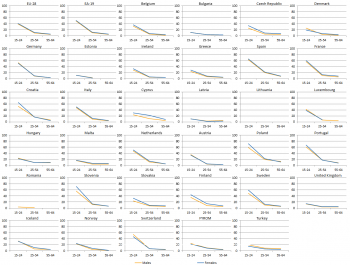
More than half of the young persons in employment in Germany, Spain, France, Croatia, Poland, Portugal and Slovenia worked under temporary contracts in 2015 (Figure 7). By contrast, very few (less than 15 %) did so in Bulgaria, Estonia, Latvia and the United Kingdom.
The use of temporary contracts falls with increase age. Women tend to be marginally more likely to have such contracts but the overall gender differences are small across all countries.
Working hours of employees
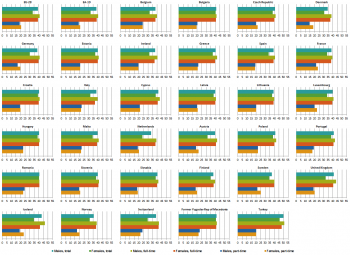
The usual working time per person per week was in 2015 on average 39.1 hours for men and 33.3 hours for women (Figure 8). As already seen in Figure 6, there is a wide gender gap in the use of part-time work, which explains most, but not all, of the difference in working time. For those working full-time, the numbers were 41.0 hours (men) and 39.3 hours (women). For the part-time workers the situation was the opposite, with women working more than men (20.9 hours versus 19.3 hours).
Comparing the countries to each other, the shortest full-time weeks for women are in Italy (37 hours), Ireland (37.2 hours), and Denmark (37.3 hours), while the longest are in the Former Yugoslav Republic of Macedonia (41.2 hours), Switzerland (41.7 hours), and Turkey (48 hours). The longest among the Member States is in the Netherlands (38.3 hours).
For full-time working men, the shortest working week is found in Denmark (38.4 hours), followed by Norway (38.7 hours), and the Netherlands (39.2 hours). By contrast, the longest are in Turkey (50.9 hours), Iceland (46.9 hours), and the United Kingdom (43.7 hours).
Self-employed
Going back to Figure 5, in the EU about one in ten persons who work (10.3 %) is self-employed without employees (own-account workers), and about one in twenty (4.1 %) is an employer in the private sector (self-employed with employees). The levels differ substantially between the countries, as the own-account workers in Greece make up close to a quarter of the persons in employment, and by contrast they are 4.7 % of the corresponding group in Denmark. Self-employed with employees are less common, ranging from 1.2 % in Romania to 6.8 % in Greece.
Foreign workers in the EU
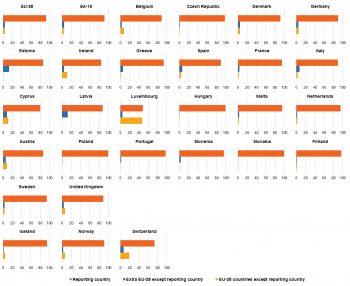
Foreign citizens made up 7.4 % of persons in employment in the EU in 2015. The split between intra- and extra-EU migrants was almost even, with 3.6 % having their citizenship from another EU country, and 3.8 % coming from outside the EU. This also means that on EU level, 92.6 % of those working worked in the county in which they have their citizenship.
Between the countries the levels varied. For Bulgaria, Croatia, Lithuania, Romania, the Former Yugoslav Republic of Macedonia, and Turkey, the levels were so low that they fell below the publication threshold of Eurostat. Among publishable results the number of foreign workers in Slovakia (0.3 %), Poland (0.3 %) , and Hungary (0.6 %) were the lowest. On the other side of the scale we find Ireland (15.5 %), Cyprus (19.9 %), Switzerland (26 %), and Luxembourg (51.5 %).
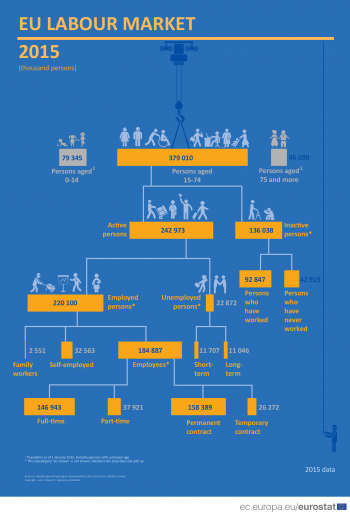
Synoptic overview: population by labour status
Figure 10 shows the main sub-populations and their relative and absolute size, as they are defined in the Labour Force Survey. Of the total EU population in 2015 of 504.4 million persons, 379 million were in the age group covered by the survey (aged 15-74). Of these, 243 million were economically active, and 136 million were the opposite (economically inactive). Furthermore, 220.1 million persons were in employment, while 22.9 million were unemployed. Employees (184.9 million) far outnumber self-employed (32.6 million), and full-time work (146.9 million) is much more common than part-time work (37.9 million).
Detailed technical and legal specifications of the Labour Force Survey are available at EU labour force survey.
Data sources and availability
Source: the European Union Labour Force Survey (EU-LFS) is a large sample, quarterly survey providing results for the population in private households in the EU, EFTA and the candidate countries. Conscripts in military or community service are not included in the results.
Reference period: Yearly results are obtained as averages of the four quarters in the year.
Coverage: The data for France cover the metropolitan territory (excluding overseas regions) Country codes: Belgium (BE), Bulgaria (BG), the Czech Republic (CZ), Denmark (DK), Germany (DE), Estonia (EE), Ireland (IE), Greece (EL), Spain (ES), France (FR), Croatia (HR), Italy (IT), Cyprus (CY), Latvia (LV), Lithuania (LT), Luxembourg (LU), Hungary (HU), Malta (MT), the Netherlands (NL), Austria (AT), Poland (PL), Portugal (PT), Romania (RO), Slovenia (SI), Slovakia (SK), Finland (FI), Sweden (SE), the United Kingdom (UK), Iceland (IS), Norway (NO), Switzerland (CH), the former Yugoslav Republic of Macedonia (MK), Turkey (TR). The abbreviation MK used for the former Yugoslav Republic of Macedonia is a provisional code which does not prejudice in any way the definitive nomenclature for this country, which will be agreed following the conclusion of negotiations currently taking place on this subject at the United Nations.
European aggregates: EU refers to the sum of EU-28 Member States and EA to the sum of the 19 euro area Member States. If data are unavailable for a country, the calculation of the corresponding aggregates takes into account the data for the same country for the most recent period available. Such cases are indicated.
Definitions: The concepts and definitions used in the survey follow the guidelines of the International Labour Organisation. Employment covers persons aged 15 years and over (16 and over in Spain, Italy and the United Kingdom, 15-74 years in Estonia, Latvia, Hungary, Finland, Sweden, Norway and Denmark, and 16-74 years in Iceland), living in private households, who during the reference week performed work, even for just one hour, for pay, profit or family gain, or were not at work but had a job or business from which they were temporarily absent, for example because of illness, holidays, industrial dispute or education and training.
The LFS employment concept differs from national accounts domestic employment, as the latter sets no limit on age or type of household, and also includes the non-resident population contributing to GDP and conscripts in military or community service.
Unemployment covers persons aged 15-74 (16-74 in Italy, Spain, the United Kingdom and Iceland) who were not employed during the reference week, were currently available for work and had either been actively seeking work in the past four weeks or had already found a job starting within the next three months.
Long-term unemployment covers persons unemployed for one year or more. Youth unemployment is unemployment of persons aged 15 to 24. Citizenship is defined according to the national legislation of each country.
Definitions of indicators reported in this publication are available on the EU-LFS Statistics Explained website: EU Labour Force Survey (Statistics Explained)
Context
The EU-LFS is the largest European household sample survey providing quarterly and annual results on labour participation of people aged 15 and over as well as on persons outside the labour force. It covers residents in private households. The EU-LFS is an important source of information about the situation and trends in the EU labour market.
Each quarter around 1.8 million interviews are conducted throughout the participating countries to obtain statistical information for some 100 variables. Due to the diversity of information and the large sample size the EU-LFS is also an important source for other European statistics like Education statistics or Regional statistics.
See also
Further Eurostat information
Publications
- Labour market statistics - Pocketbook - 2011 edition
- European Union Labour force survey - selection of electronic articles (Statistics Explained)
Main tables
Database
Dedicated section
Methodology / Metadata
Notes
- ↑ The article Youth unemployment explains more detailed how youth unemployment is measured.