Archive:Enlargement countries - education statistics
- Data from MM/YYYY, most recent data: Further Eurostat information, Main tables and Database.
This article presents population-related information and statistics on the education systems in the enlargement countries and is based on the Key figures on the enlargement countries – 2013 edition. It gives an overview of the demographic development, covering the most important indicators, i.e. crude birth rate, crude death rate and fertility. It also offers information on major trends at different educational levels in terms of enrolment, educational attainment and tertiary education.
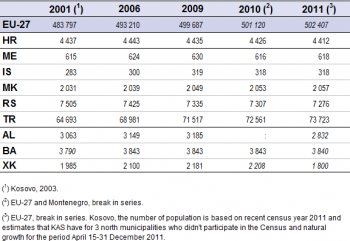
Source: for the EU-27, Eurostat (online data code: (demo_pjan)); for the enlargement countries, Eurostat (online data code: (cpc_psdemo))
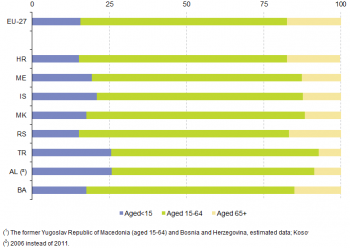
Source: for the EU-27, (online data code:Eurostat (demo_pjangroup)); for the enlargement countries, Eurostat (online data code: (cpc_psdemo))
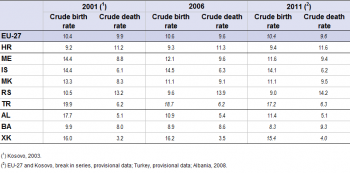
Source: for the EU-27, Eurostat, (online data code: (demo_gind)); for the enlargement countries, Eurostat (online data code: (cpc_psdemo))
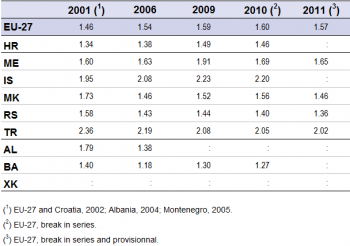
Source: for the EU-27, Eurostat (online data code: (demo_find)); for the enlargement countries, Eurostat (online data code: (cpc_psdemo))
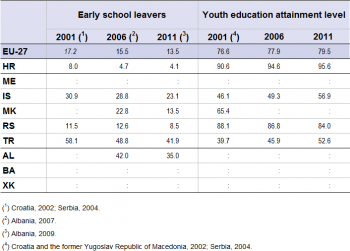
Source: for the EU-27, Eurostat (online data codes: (edat_lfse_14) and (edat_lfse_08)); for the enlargement countries, Eurostat (online data codes: (cpc_psilc) and (cpc_siinr))
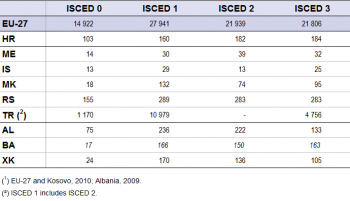
Source: for the EU-27, Eurostat (online data code: (educ_ilev)); for the enlargement countries, Eurostat (online data code: (cpc_pseduc)
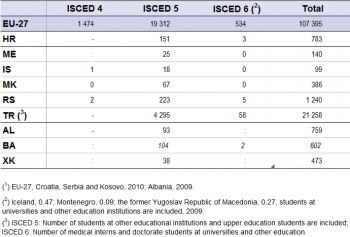
Source: for the EU-27, Eurostat (online data code: (educ_ilev)); for the enlargement countries, Eurostat (online data code: (cpc_pseduc)
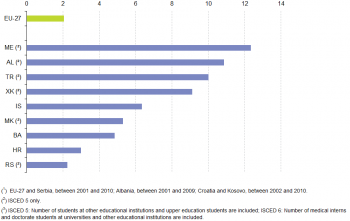
Source: for the EU-27, (online data code:Eurostat (educ_enrl1tl)); for the enlargement countries, Eurostat (online data code: (cpc_pseduc))
Main statistical findings
Population
Different trends of population over time
In 2011, more than 500 million persons were resident in the European Union. That same year, the combined population of the enlargement countries represented nearly a fifth of the total EU-27 population. Turkey was by far the largest among them, with more than 73 million inhabitants (corresponding to 15 % of the EU-27), whereas Iceland and Montenegro were the smallest, with populations of 318 thousand and 618 thousand respectively.
Over time, the demographic evolution in the enlargement countries was quite diverse: whereas the population in Turkey and Iceland increased by 14% and 12% respectively between 2001 and 2011, that of Kosovo [1] (-9 %), Albania (-8 %) and Serbia (-3 %) decreased significantly over the same period (or between 2003 and 2011 for Kosovo). The other four enlargement countries saw their numbers of inhabitants remain relatively stable during this decade, either dropping or increasing by only about 1 %.
A younger population in Turkey and Albania
In the EU-27, as well as in all of the enlargement countries for which data are available for 2011, the working age population (persons aged 15-64) accounted for just over two-thirds of the total population. However, the proportion of the population in the age ranges below and above the working population varied widely. In the EU-27, as well as in Croatia and Serbia, only around 15 % of the population was below the age of 15 in 2011, compared to around 26 % in Turkey (for the same reference year) and in Albania (2006 data). Conversely, while approximately 17 % of the population was aged 65 or over in the EU-27, Croatia and in Serbia, only around 9 % represented that age group in Albania and 7 % in Turkey. Hence, the latter countries clearly have the youngest population among the enlargement countries, which puts considerable pressure on the national educational systems and the labour market.
Crude birth rates higher than crude death rates in most countries
A crude rate of natural increase can be calculated by subtracting the crude death rate from the crude birth rate, with a positive result showing that the size of the population is growing, disregarding the effects of migration. In the past years, Croatia, Serbia and Bosnia and Herzegovina were the only countries to experience crude death rates markedly higher than crude birth rates. Moreover, this discrepancy rose with time, indicating a faster population decline. Hence, the crude rate of natural decrease in this case (rather than increase) was 5.2 per thousand inhabitants in Serbia and 2.2 in Croatia in 2011. In contrast, the largest crude rate of natural increase was recorded in Kosovo, with a value of 11.4 per thousand inhabitants, closely followed by Turkey with 10.9 in 2011.
Fertility rates of over 2 children per woman in Iceland and Turkey
Only two of the enlargement countries, Iceland and Turkey, recorded fertility rates of over 2 children per woman in the latest years for which data are available. In Turkey, the rate fell between 2001 and 2011 from 2.4 to 2.0, whereas in Iceland it rose from 1.95 to 2.20 between 2001 and 2010, making for the highest rate among the enlargement countries in 2010. The rates were more volatile in most of the other enlargement countries, at a lower level in absolute terms; the EU-27 recorded a rising tendency in the fertility rate up to 2010.
Education
Croatia and Serbia with low percentages of early school leavers…
Education and training policies are central to the Europe 2020 strategy in order to turn the EU into a smart, sustainable and inclusive economy. One of the flagship initiatives of Europe 2020 is ‘Youth on the move’ which aims to enhance the performance of education systems and to facilitate the entry of young people into the labour market. In particular, one of the headline targets of Europe 2020 is to reduce the share of early school leavers to less than 10 % of the population aged 18–24.
Between 2001 and 2011, the proportion of early school leavers fell in the EU-27 as well as in all the enlargement countries for which data are available. The decrease amounted to 3.7 percentage points in the EU-27 to reach 13.5 percent in 2011. For the enlargement countries, the decrease ranged between 3.0 and 4.0 percentage points in Croatia and Serbia over the period for which data are available, while Iceland and Turkey saw their figures decrease substantially, by 7.8 and 16.2 percentage points respectively. Compared to the 13.5 % of early school leavers in 2011 in the EU-27, Serbia and, especially, Croatia reported significantly low figures (less than 10 % of early school leavers). In contrast, in both Albania and Turkey the proportion of early school leavers was 35.0 % and 41.9 % respectively, according to the latest available data.
… and high youth education attainment levels
Since 2001, the share of the EU population aged 20 to 24 that reached at least an education level of ISCED 3 (upper secondary education) had been steadily rising and was close to 80 % in 2011. Similar trends can be observed in the enlargement countries for which data are available, with the exception of Serbia which recorded a downward trend after 2004. Nevertheless, the youth education attainment level in Serbia (84 %) was higher than that of the EU-27 average in 2011, and ranked second behind the impressive figure of 96 % in Croatia.
Tertiary education in permanent development
In 2011, the EU-27 counted 107 million pupils and students (from pre-primary to tertiary education). In the enlargement countries, around 26 million pupils and students were enrolled in the same year. Obviously, the number of pupils depends on various factors, such as the size and structure of the population, the characteristics of the educational system (e.g. the length of compulsory schooling) and the opportunities on the labour market.
On closer inspection, the increase in the number of students attending tertiary education was faster in all enlargement countries than at EU level. Indeed, while the EU saw their figures increasing on average by 2% per year since 2001, the enlargement countries recorded annual average growth rates ranging between 2.2% in Serbia and 12.3% in Montenegro. This means that the number of students attending tertiary education in Montenegro more than tripled between 2001 and 2011. It is also worth mentioning that Turkey, Albania and, to a lesser extent, also Kosovo, saw their numbers more than double, far above the 20% increase at EU level.
Data sources and availability
Data for a core set of indicators are collected each year through questionnaires sent out by Eurostat to the partner countries. A network of contacts in each country has been established for updating the questionnaires. Eurostat distributes the electronic questionnaires to a single contact point in each partner country. This contact point is in charge of the onward distribution of the questionnaires to the various thematic co-ordinators in each country's statistical system (generally within the national Statistical Offices) and of their collection afterwards. When completed, the validated and updated questionnaires are sent back to Eurostat.
Context
Eurostat collects statistical information on the demographic conditions and education in enlargement countries. These data allow a better understanding of the situation in these countries and allow comparisons with the European Union. These data are also used when the European Commission prepares its annual strategy document detailing its policy on EU enlargement and the progress reports on the political and economic developments in enlargement countries.
Further Eurostat information
Publications
- Key figures on the enlargement countries – 2013 edition
- Pocketbook on the enlargement countries - 2012 edition
- Enlargement countries - Population and social conditions - 2013 edition
Database
- Population and social conditions (cpc_ps)
- Candidate countries and potential candidates: population - demography (cpc_psdemo)
- Candidate countries and potential candidates: education (cpc_pseduc)
- Population (populat), see:
- Demography (pop)
- Demography - National data (demo)
- Population (demo_pop)
- Demography - National data (demo)
- Education (educ)
- Education indicators - non-finance (educ_indic)
- Distribution of pupils/ Students by level (educ_ilev)
- Education indicators - non-finance (educ_indic)
Dedicated section
External links
See also
- Other articles on the enlargement countries
- Background articles on international statistical cooperation
- Population and population change statistics
- Population projections
- Population structure and ageing
- Sustainable development - demographic changes
Notes
- ↑ This designation is without prejudice to positions on status, and is in line with UNSCR 1244 and the ICJ Opinion on the Kosovo Declaration of Independence.