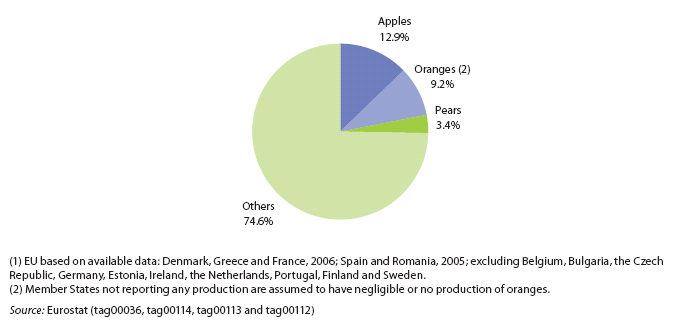
File:Breakdown of production of fruit, EU, 2007 (1)(% of total, based on tonnes).PNG
Revision as of 11:14, 15 October 2009 by Verdodo (talk | contribs) (→Most recent data available now, see:)
Breakdown_of_production_of_fruit,_EU,_2007_(1)(%_of_total,_based_on_tonnes).PNG (689 × 329 pixels, file size: 21 KB, MIME type: image/png)
Breakdown of production of fruit, EU, 2007
- (% of total, based on tonnes).
Graph created with data from September 2008
Most recent data available now, see:
Apples, production - 1 000 t (tag00036)
Oranges, production - 1 000 t (tag00114)
File usage
There are no pages that use this file.
