File:Output price indices, selected service activities, EU-27, 2006-2011 (1) (2006=100) partA-fr.png
Revision as of 15:59, 18 October 2012 by EXT-Z-Konstantinou (talk | contribs) (uploaded a new version of "File:Output price indices, selected service activities, EU-27, 2006-2011 (1) (2006=100) partA-fr.png": Abbildung 3a: Erzeugerpreisindizes, ausgewählte Dienstleistungsbranchen, EU-27, 2006-2011 (1)<br>(2006=100) – Quelle: )
Output_price_indices,_selected_service_activities,_EU-27,_2006-2011_(1)_(2006=100)_partA-fr.png (573 × 325 pixels, file size: 9 KB, MIME type: image/png)
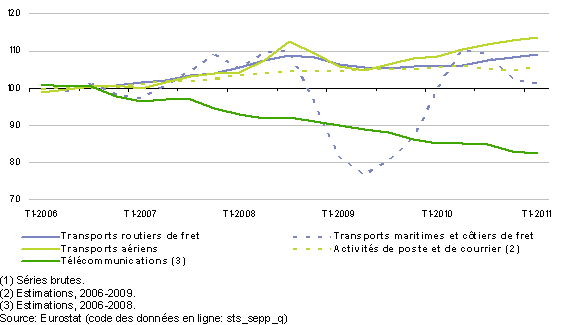
Graphique 3a: Indices des prix à la production, sélection d’activités de services, UE-27, 2006-2011 (1)
(2006=100) - Source: Eurostat (sts_sepp_q)
File usage
There are no pages that use this file.
