Tutorials
Log in
Statistics Explained
menu
search
search
Navigation
Main page
Statistical themes
Glossary
Categories
Statistics 4 beginners
Tutorials
Help
Eurostat home
Education corner
Online publications
Regional yearbook
Sustainable development
Full list
Tools
User contributions
Logs
View user groups
Special pages
search
Navigation
Main page
Statistical themes
Glossary
Categories
Statistics 4 beginners
Tutorials
Help
Eurostat home
Education corner
Online publications
Regional yearbook
Sustainable development
Full list
Tools
User contributions
Logs
View user groups
Special pages
Navigation
Main page
Statistical themes
Glossary
Categories
Statistics 4 beginners
Tutorials
Help
Eurostat home
Education corner
Online publications
Regional yearbook
Sustainable development
Full list
Tools
User contributions
Logs
View user groups
Special pages
Uploads by Staniiu
This special page shows all uploaded files.
File list
Items per page:
20
50
100
250
500
Search for media name:
Username:
Include old versions of files
Go
Date
Name
Thumbnail
Size
Description
Versions
18:51, 13 July 2012
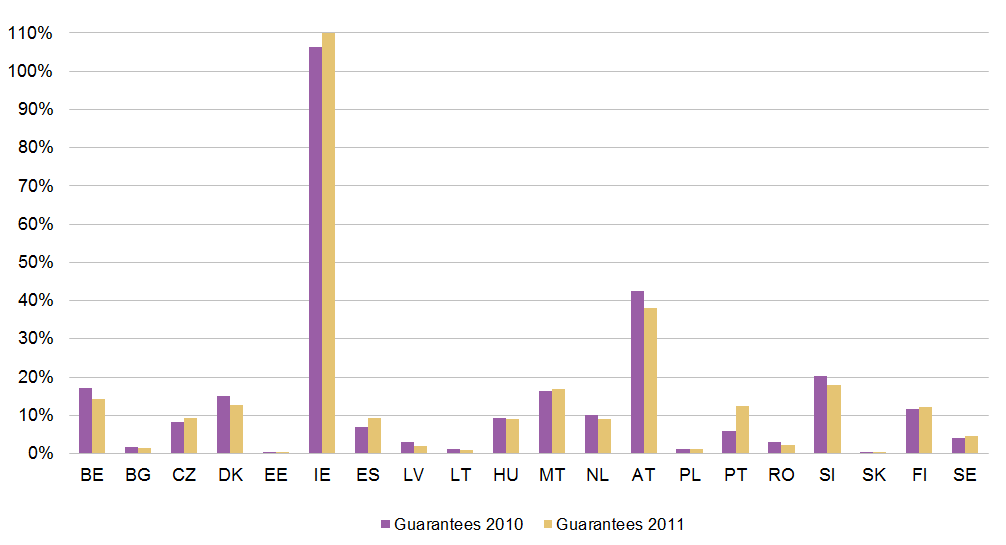
State guarantees as a percentage of GDP, 2010-2011.png
(
file
)
9 KB
1
14:26, 9 July 2012
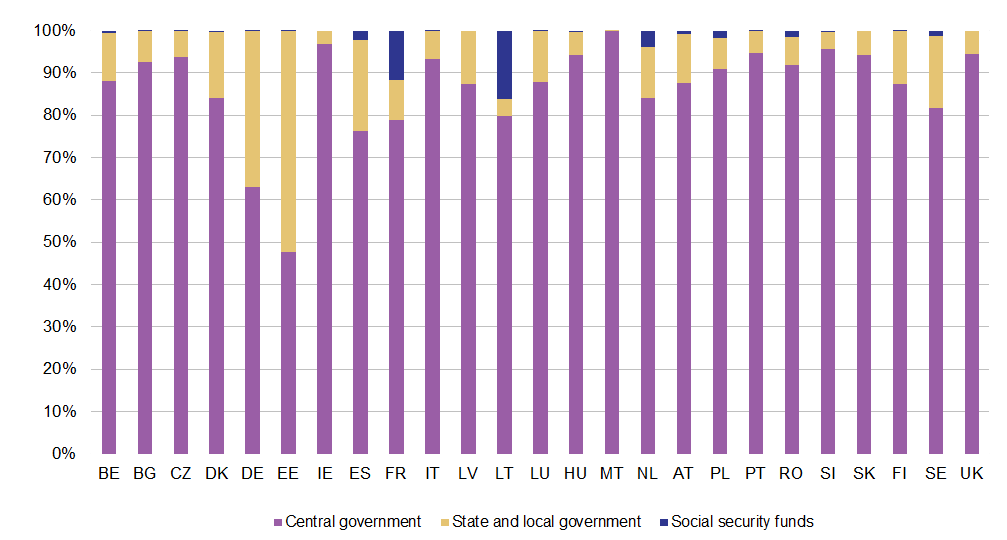
Debt by subsector, 2011.png
(
file
)
13 KB
1
14:11, 9 July 2012
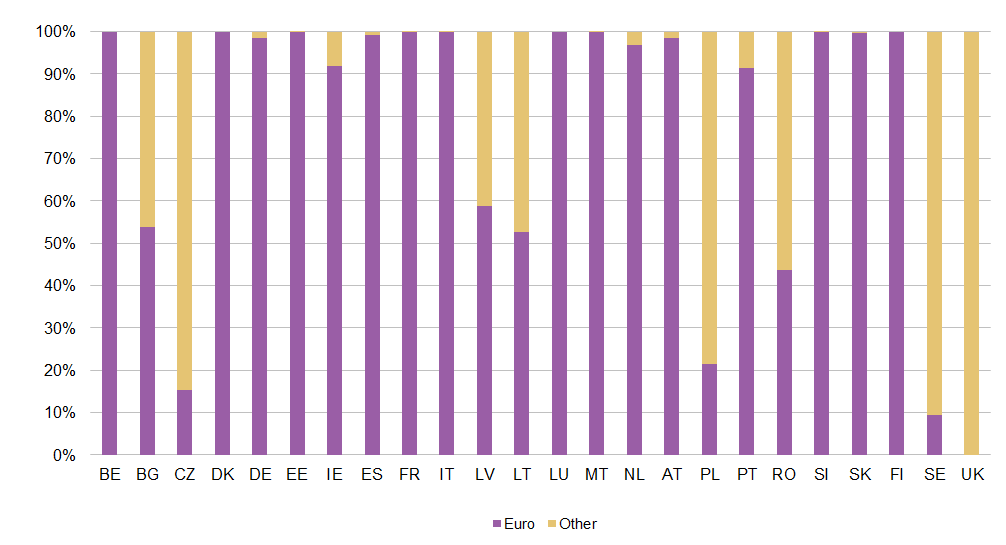
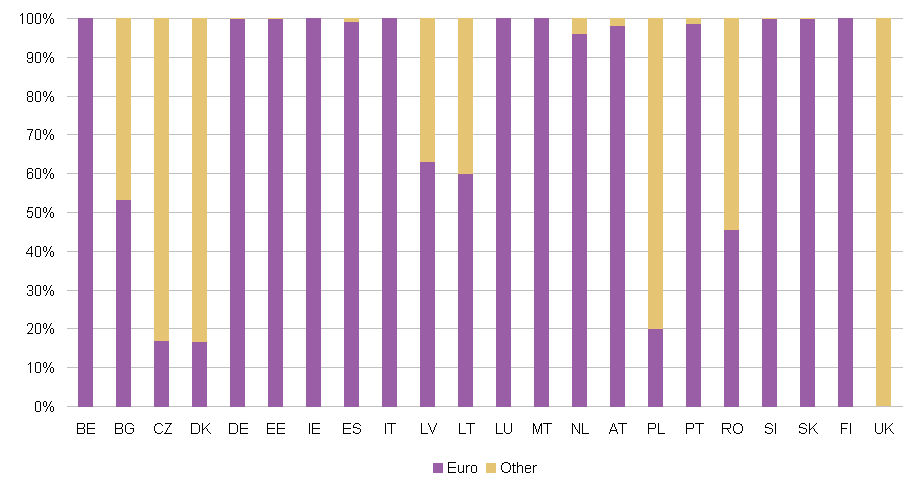
Outstanding debt with euro as issuing currency, 2011.png
(
file
)
12 KB
1
14:10, 9 July 2012
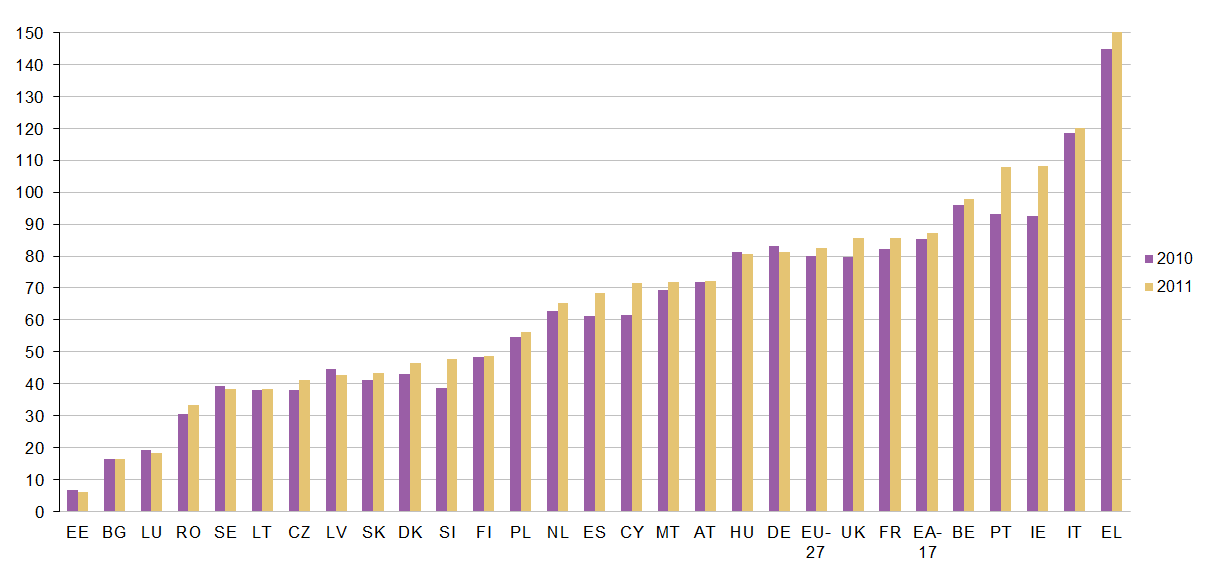
Maastricht Debt as a percentage of GDP, 2010-2011.png
(
file
)
12 KB
1
14:09, 9 July 2012
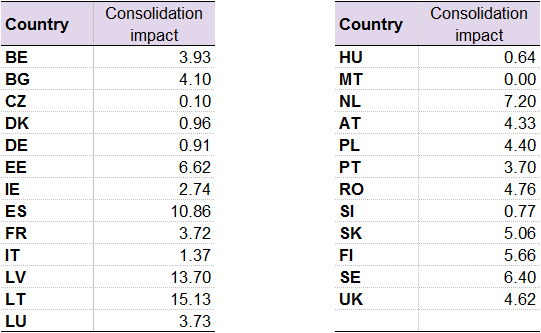
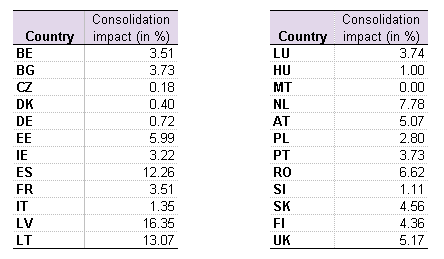
Impact of consolidation, 2011.png
(
file
)
8 KB
1
14:08, 9 July 2012
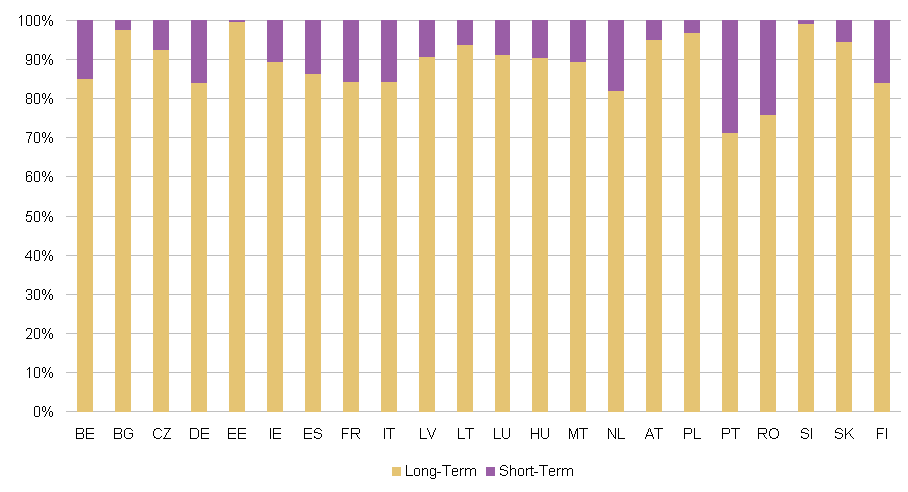
Debt by maturity, 2011.png
(
file
)
11 KB
1
14:07, 9 July 2012
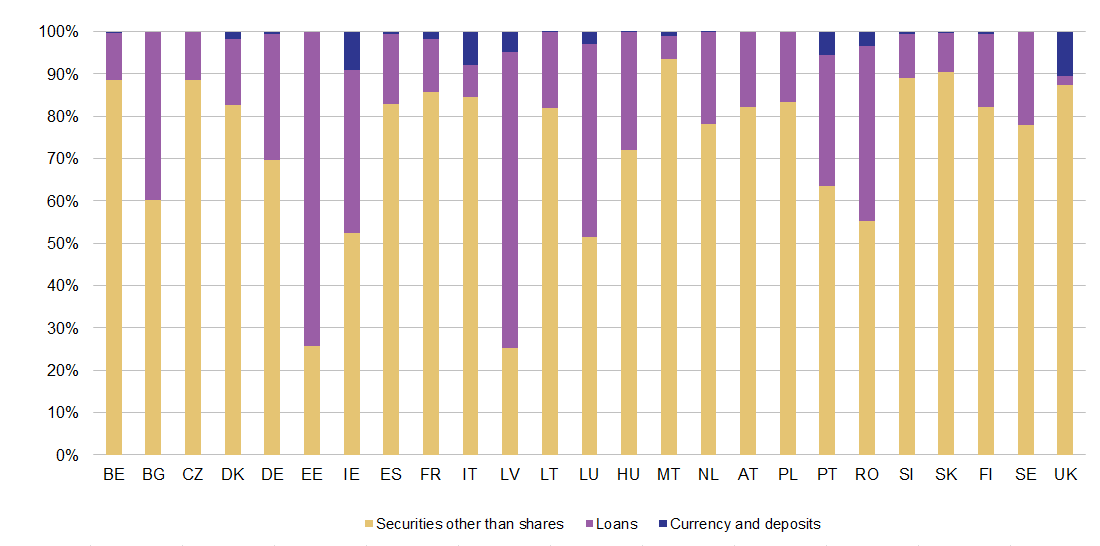
Debt by financial instrument, 2011.png
(
file
)
14 KB
1
14:06, 9 July 2012
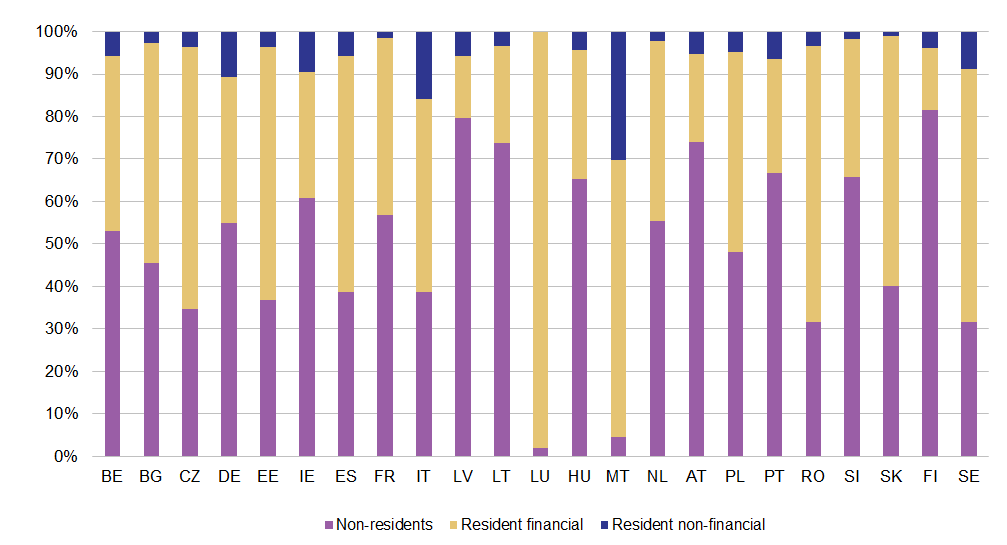
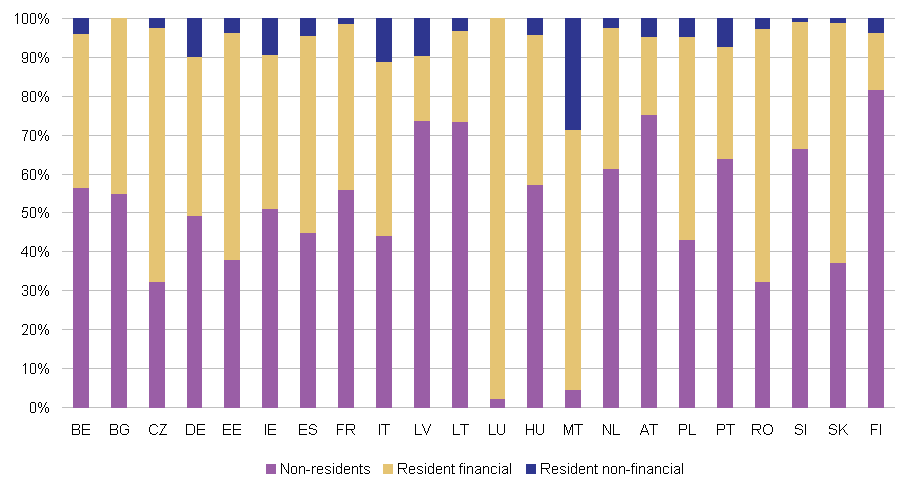
Debt by debt holder, 2011.png
(
file
)
13 KB
1
14:06, 9 July 2012
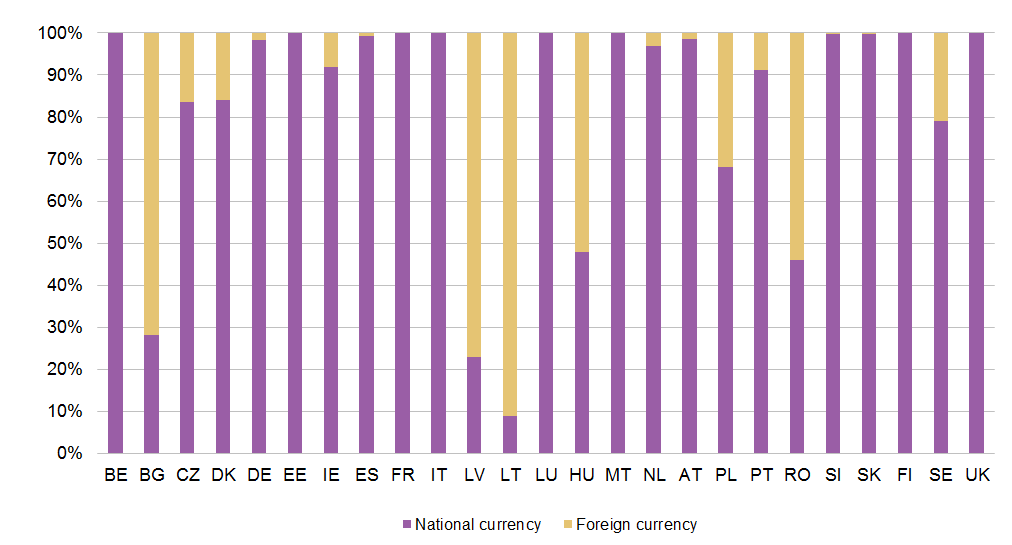
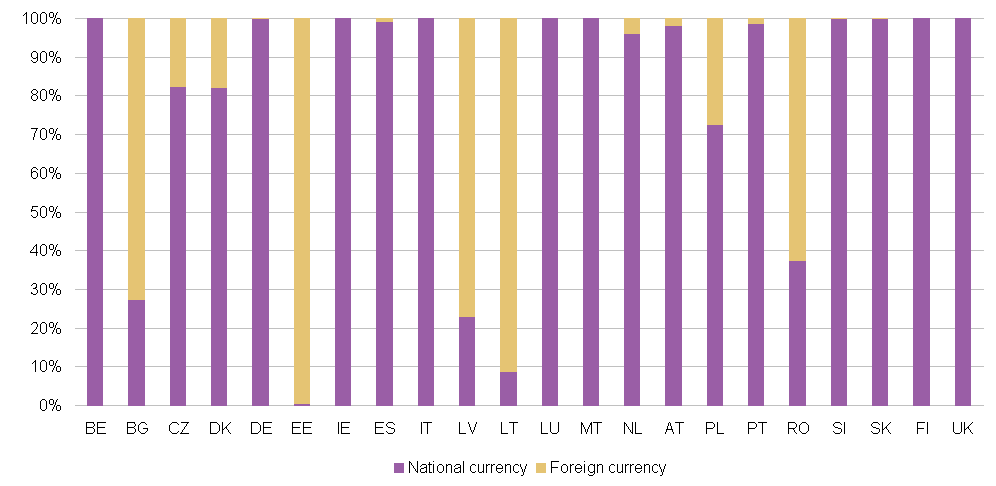
Debt by currency, 2011.png
(
file
)
13 KB
1
14:05, 9 July 2012
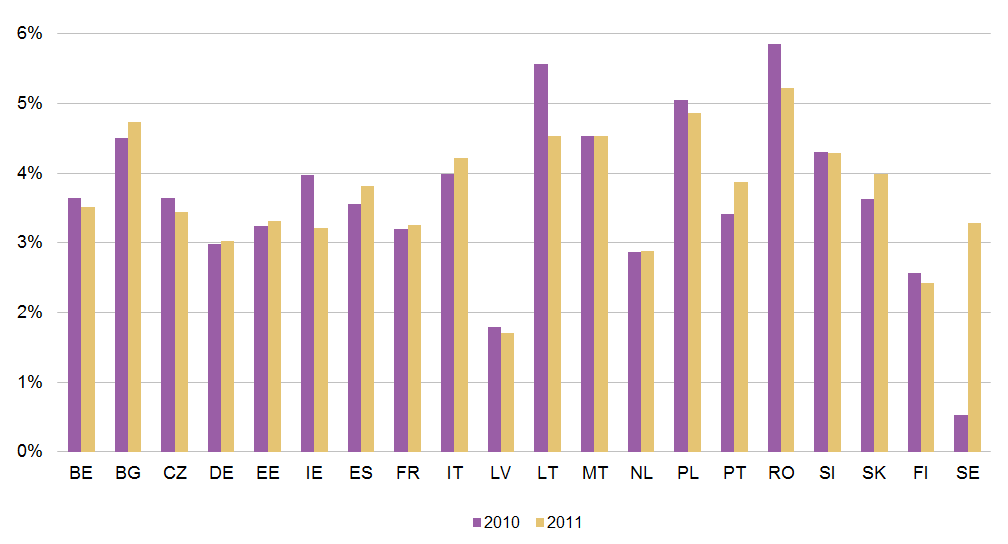
Apparent average cost of governmental debt, 2010-2011.png
(
file
)
10 KB
1
17:22, 20 December 2011
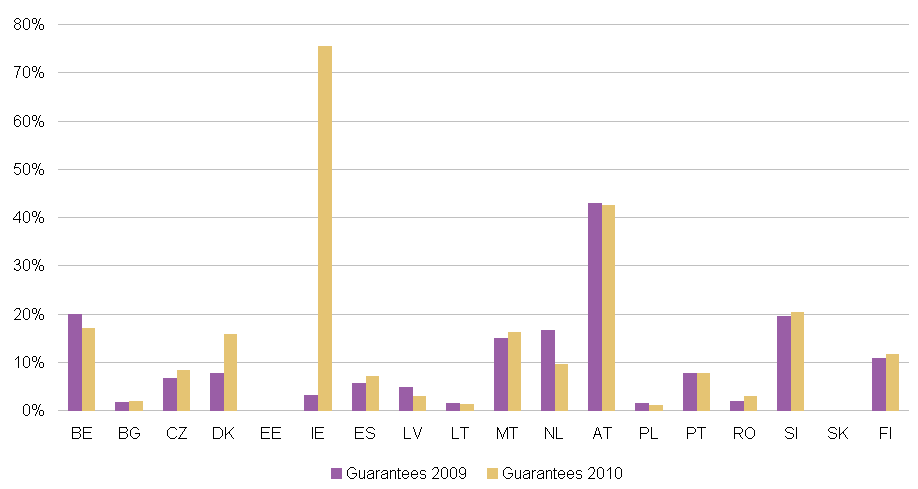
State guarantees as a percentage of GDP, 2009-2010.png
(
file
)
6 KB
1
17:21, 20 December 2011
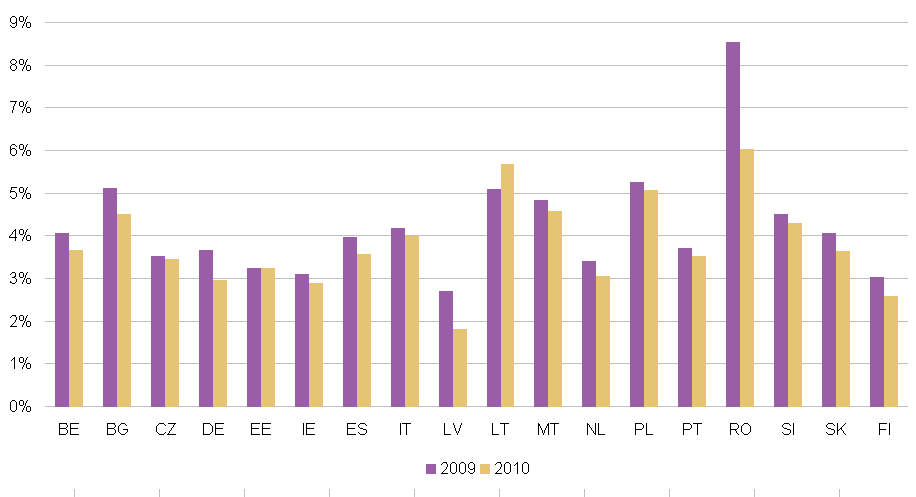
Apparent average cost of governmental debt, 2009-2010.png
(
file
)
7 KB
1
17:21, 20 December 2011
Impact of consolidation, 2010.png
(
file
)
4 KB
1
17:20, 20 December 2011
Outstanding debt with euro as issuing currency, 2010.png
(
file
)
8 KB
1
17:20, 20 December 2011
Debt by currency, 2010.png
(
file
)
10 KB
1
17:19, 20 December 2011
Debt by maturity, 2010.png
(
file
)
7 KB
1
17:08, 20 December 2011
Debt by debt holder, 2010.png
(
file
)
9 KB
1
Special page
ISSN 2443-8219


