Tutorials
Log in
Statistics Explained
menu
search
search
Navigation
Main page
Statistical themes
Glossary
Categories
Statistics 4 beginners
Tutorials
Help
Eurostat home
Education corner
Online publications
Regional yearbook
Sustainable development
Full list
Tools
User contributions
Logs
View user groups
Special pages
search
Navigation
Main page
Statistical themes
Glossary
Categories
Statistics 4 beginners
Tutorials
Help
Eurostat home
Education corner
Online publications
Regional yearbook
Sustainable development
Full list
Tools
User contributions
Logs
View user groups
Special pages
Navigation
Main page
Statistical themes
Glossary
Categories
Statistics 4 beginners
Tutorials
Help
Eurostat home
Education corner
Online publications
Regional yearbook
Sustainable development
Full list
Tools
User contributions
Logs
View user groups
Special pages
Uploads by Kissanc
This special page shows all uploaded files.
File list
Items per page:
20
50
100
250
500
Search for media name:
Username:
Include old versions of files
Go
Date
Name
Thumbnail
Size
Description
Versions
12:34, 30 September 2021
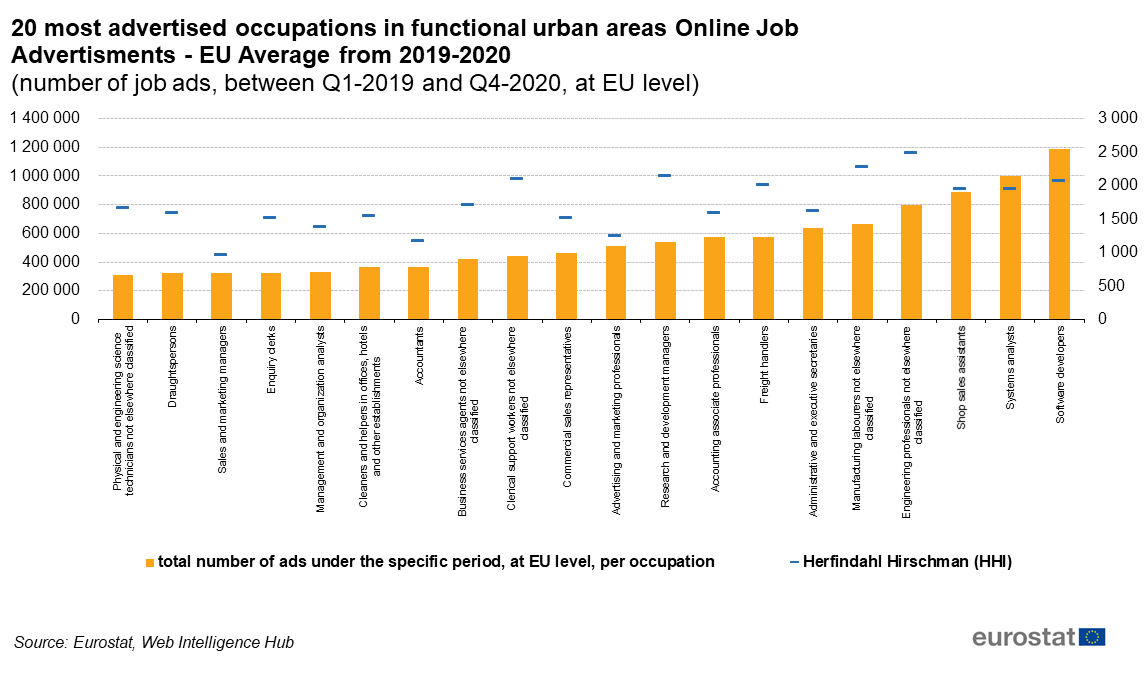
20 most advertised occupations in functional urban areas Online Job Advertisments - EU Average from 2019-2020.png
(
file
)
76 KB
2
15:53, 13 August 2021
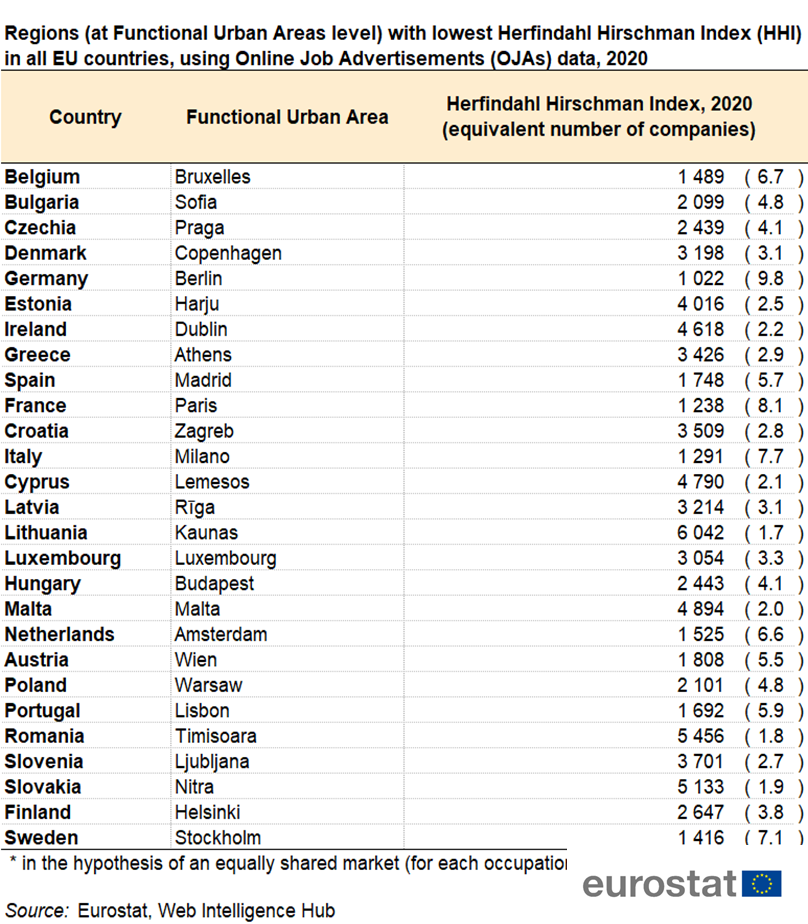
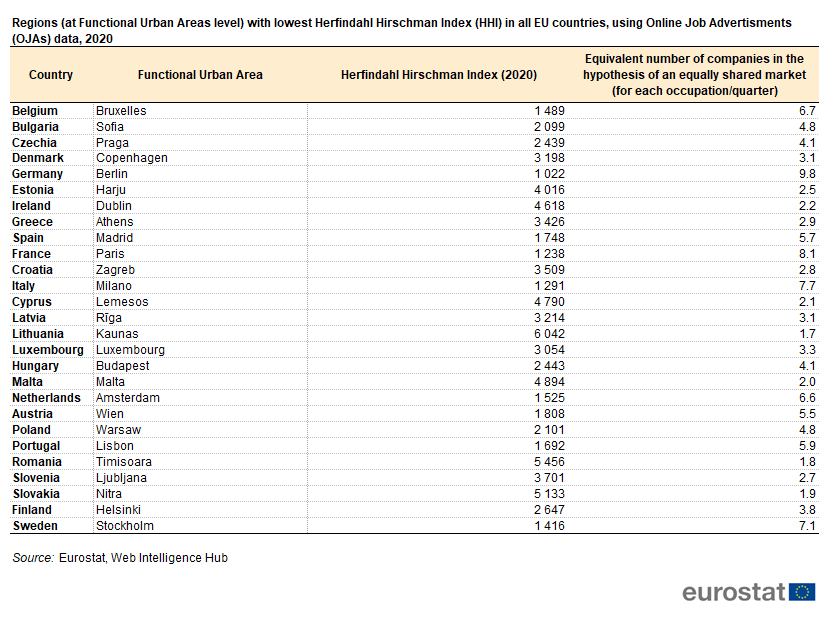
Regions (at Functional Urban Areas level) with lowest HHI in all EU countries, using OJAs data, 2020 Country.png
(
file
)
375 KB
4
12:08, 6 August 2021
Oja hhi results Estat layout Experimental statistics.xlsx
(
file
)
2.21 MB
3
12:07, 6 August 2021
Oja hhi results Estat layout SE.xlsx
(
file
)
1.94 MB
4
11:40, 6 August 2021
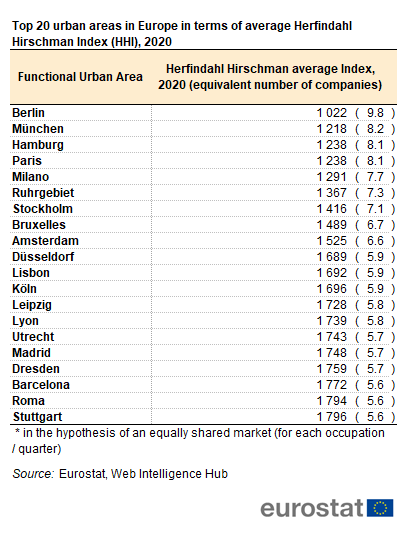
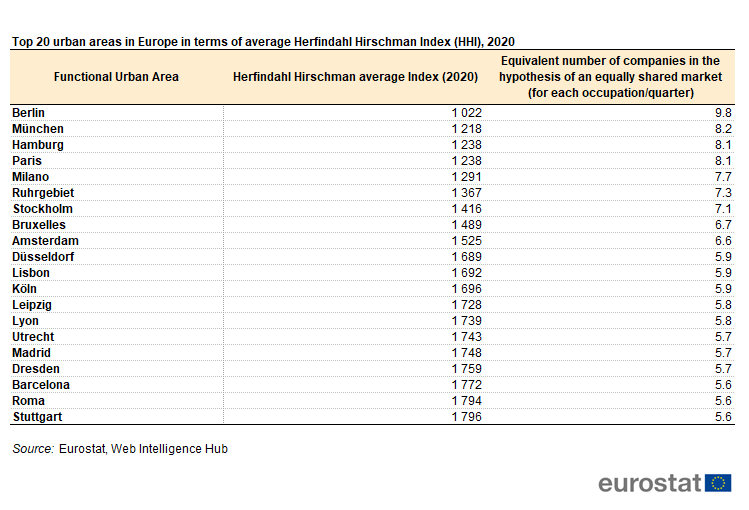
Top 20 urban areas in Europe in terms of average HHI, 2020 Functional Urban Area.png
(
file
)
33 KB
1
16:05, 5 August 2021
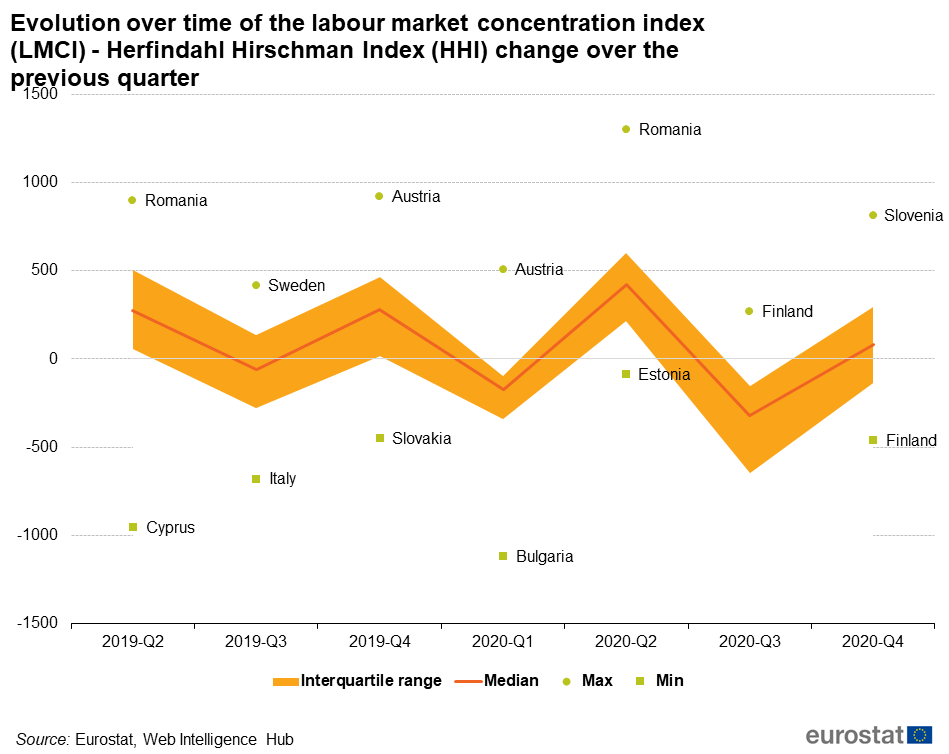
Evolution over time of the (LMCI) (HHI) change over the previous quarter.png
(
file
)
58 KB
1
16:04, 5 August 2021
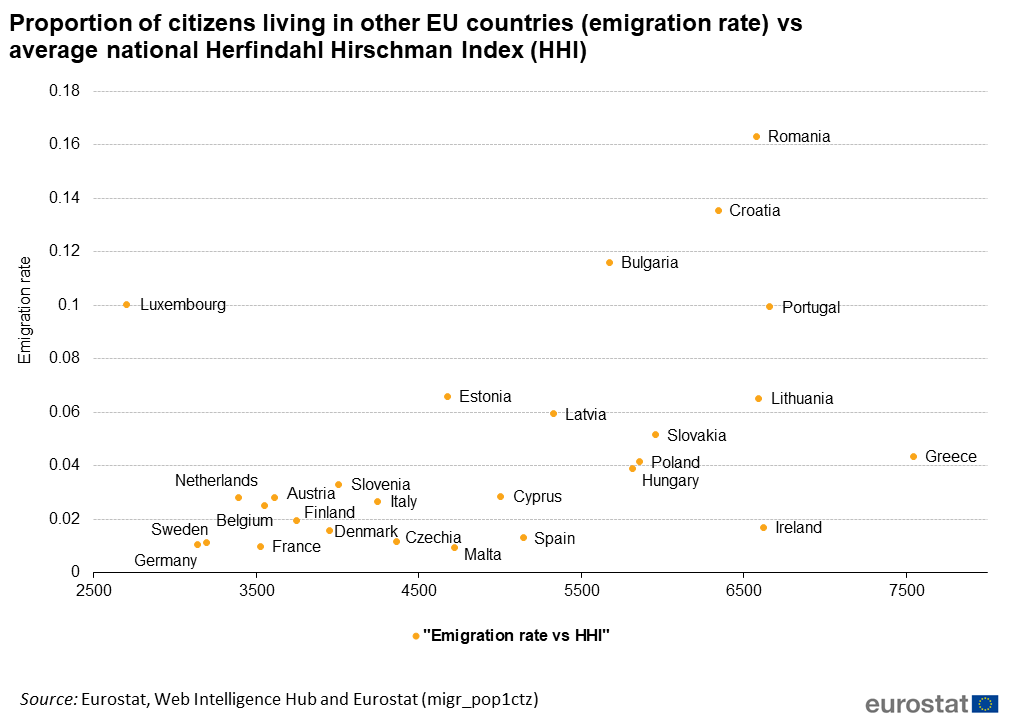
Proportion of citizens living in other EU countries (emigration rate) vs average national (HHI).png
(
file
)
49 KB
1
11:45, 5 August 2021
Regions (at Functional Urban Areas level) with lowest HHI in all EU countries, using OJAs data, 2020 Country V2.png
(
file
)
53 KB
1
11:44, 5 August 2021
Top 20 urban areas in Europe in terms of average Herfindahl Hirschman Index (HHI), 2020 Functional Urban Area.png
(
file
)
35 KB
2
11:39, 4 August 2021
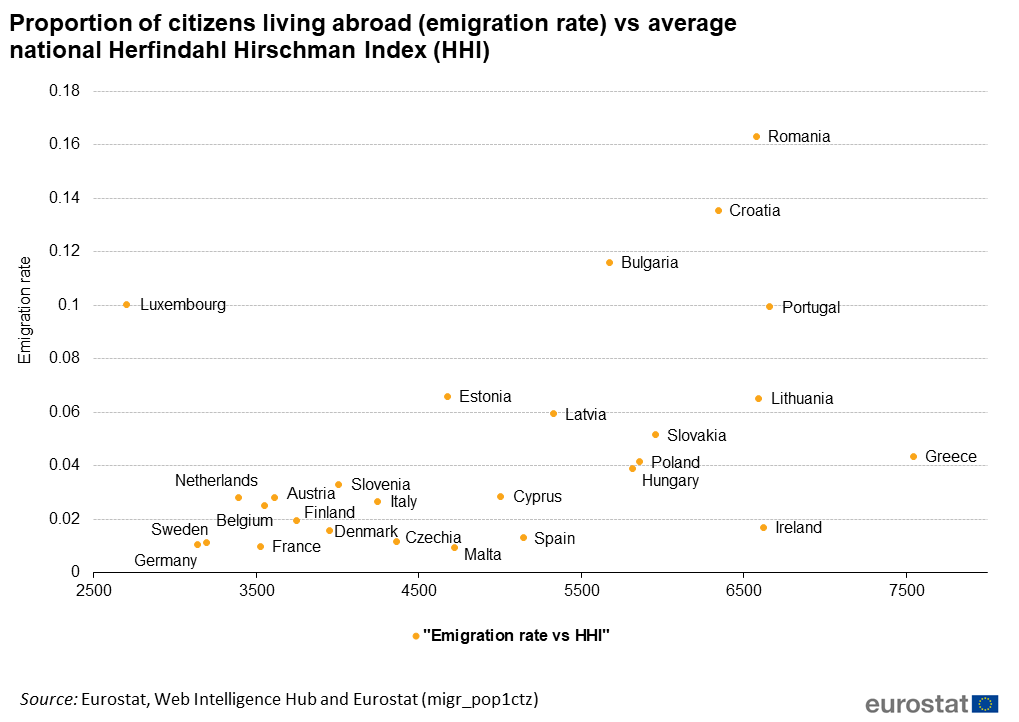
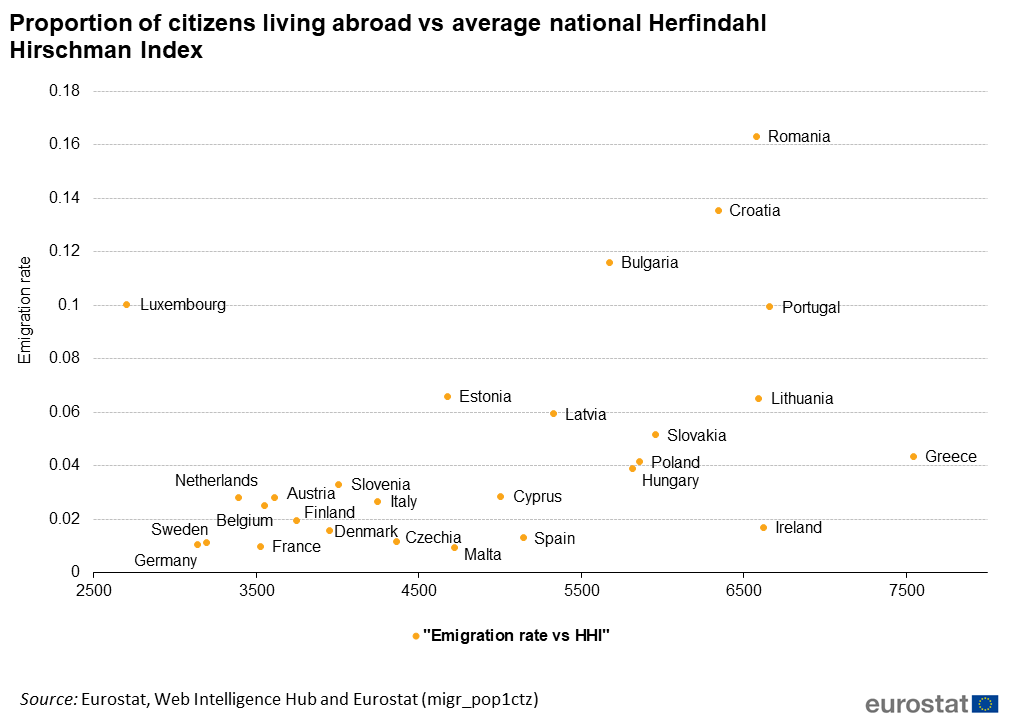
Proportion of citizens living abroad (emigration rate) vs average national Herfindahl Hirschman Index (HHI).png
(
file
)
48 KB
1
15:31, 2 August 2021
Oja hhi results published Estat layout SE.xlsx
(
file
)
2.1 MB
3
15:31, 2 August 2021
Proportion of citizens living abroad vs average national Herfindahl Hirschman Index.png
(
file
)
46 KB
2
16:03, 30 July 2021
Oja hhi results published Estat layout SE.xls
(
file
)
2.11 MB
1
15:55, 30 July 2021
Ojahhi Methodological Note Final.pdf
(
file
)
969 KB
1
12:31, 30 July 2021
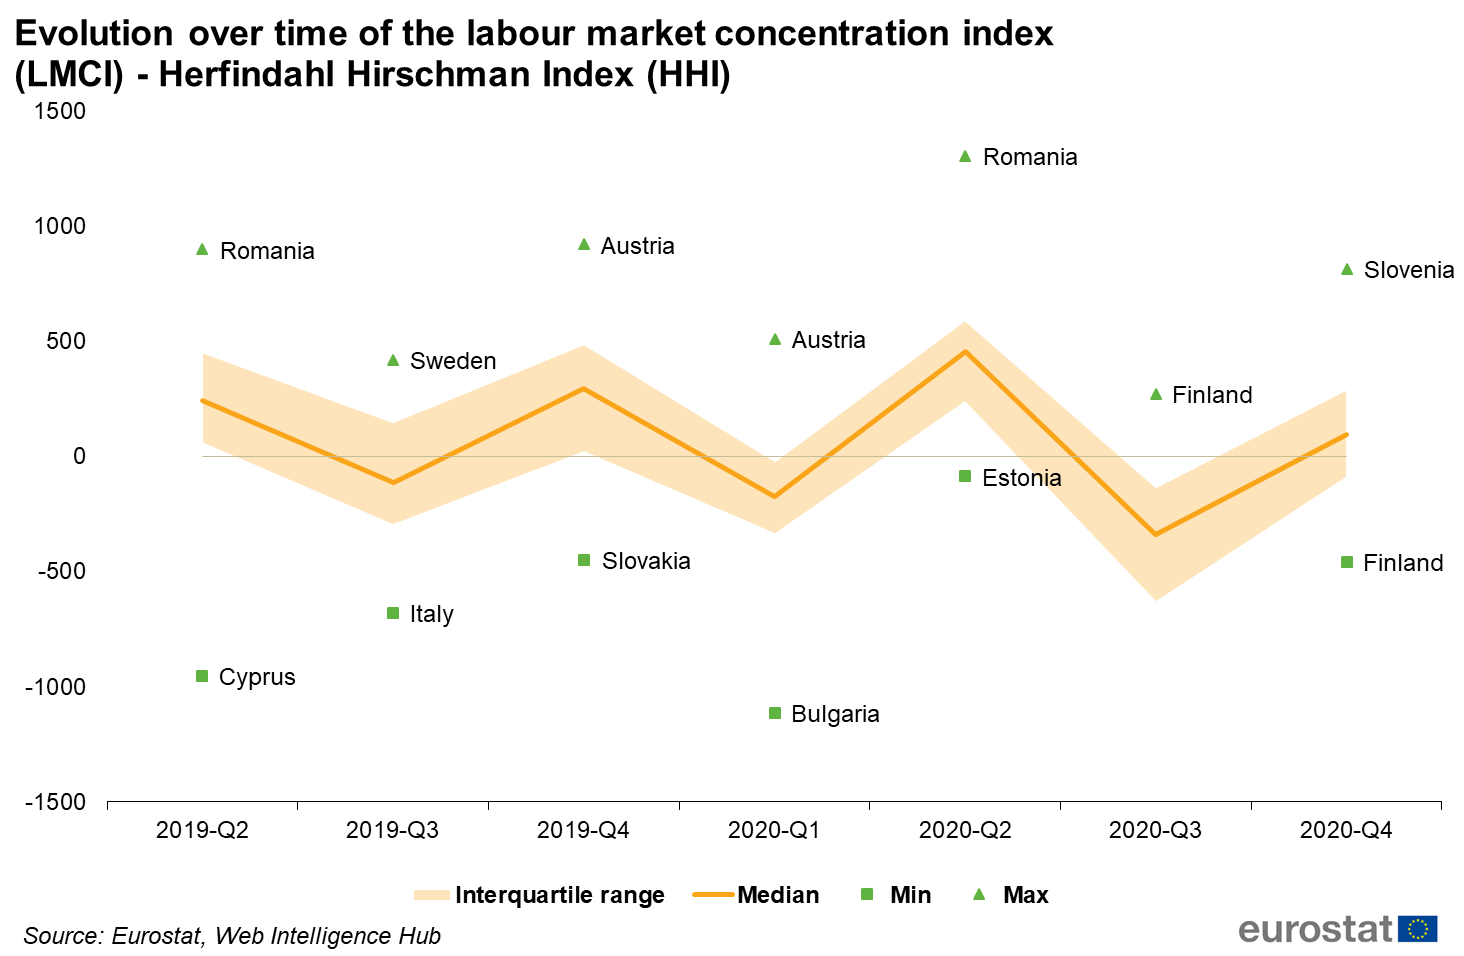
Evolution over time of the labour market concentration index (LMCI) - Herfindahl Hirschman Index (HHI) .png
(
file
)
92 KB
1
12:30, 30 July 2021
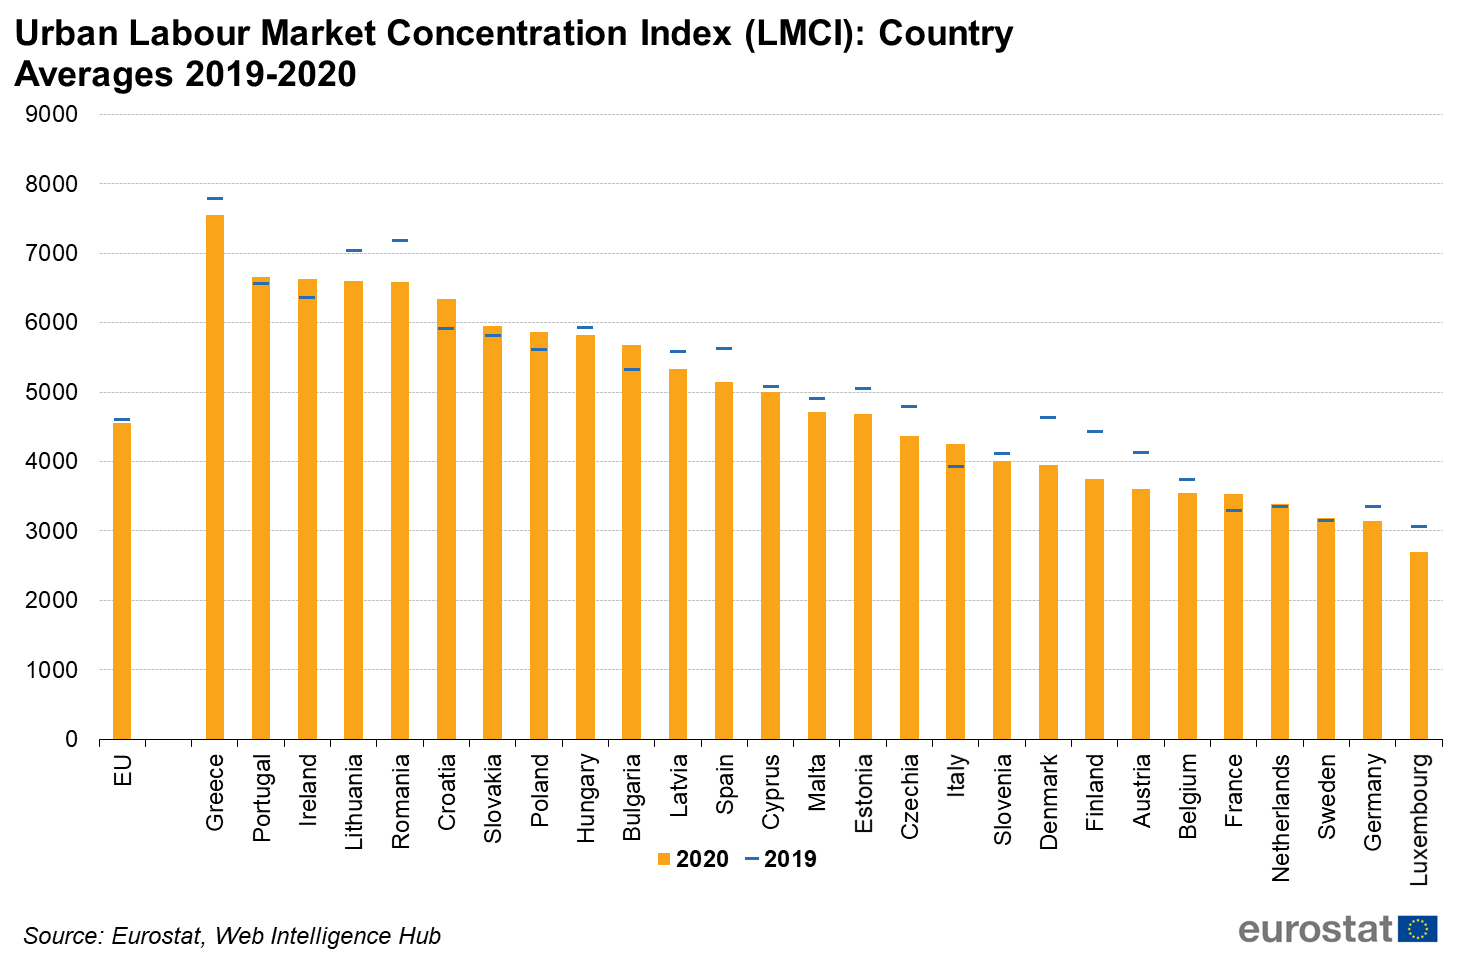
Urban Labour Market Concentration Index (LMCI) Country Averages 2019-2020.png
(
file
)
128 KB
1
12:11, 30 July 2021
Top 20 regions in Europe (at FUA level) in terms of average HHI index , 2020.png
(
file
)
123 KB
2
06:36, 29 July 2021
Regions (FUA level) with lowest HHI index in all european countries, using OJA data, 2020.png
(
file
)
275 KB
2
13:23, 27 July 2021
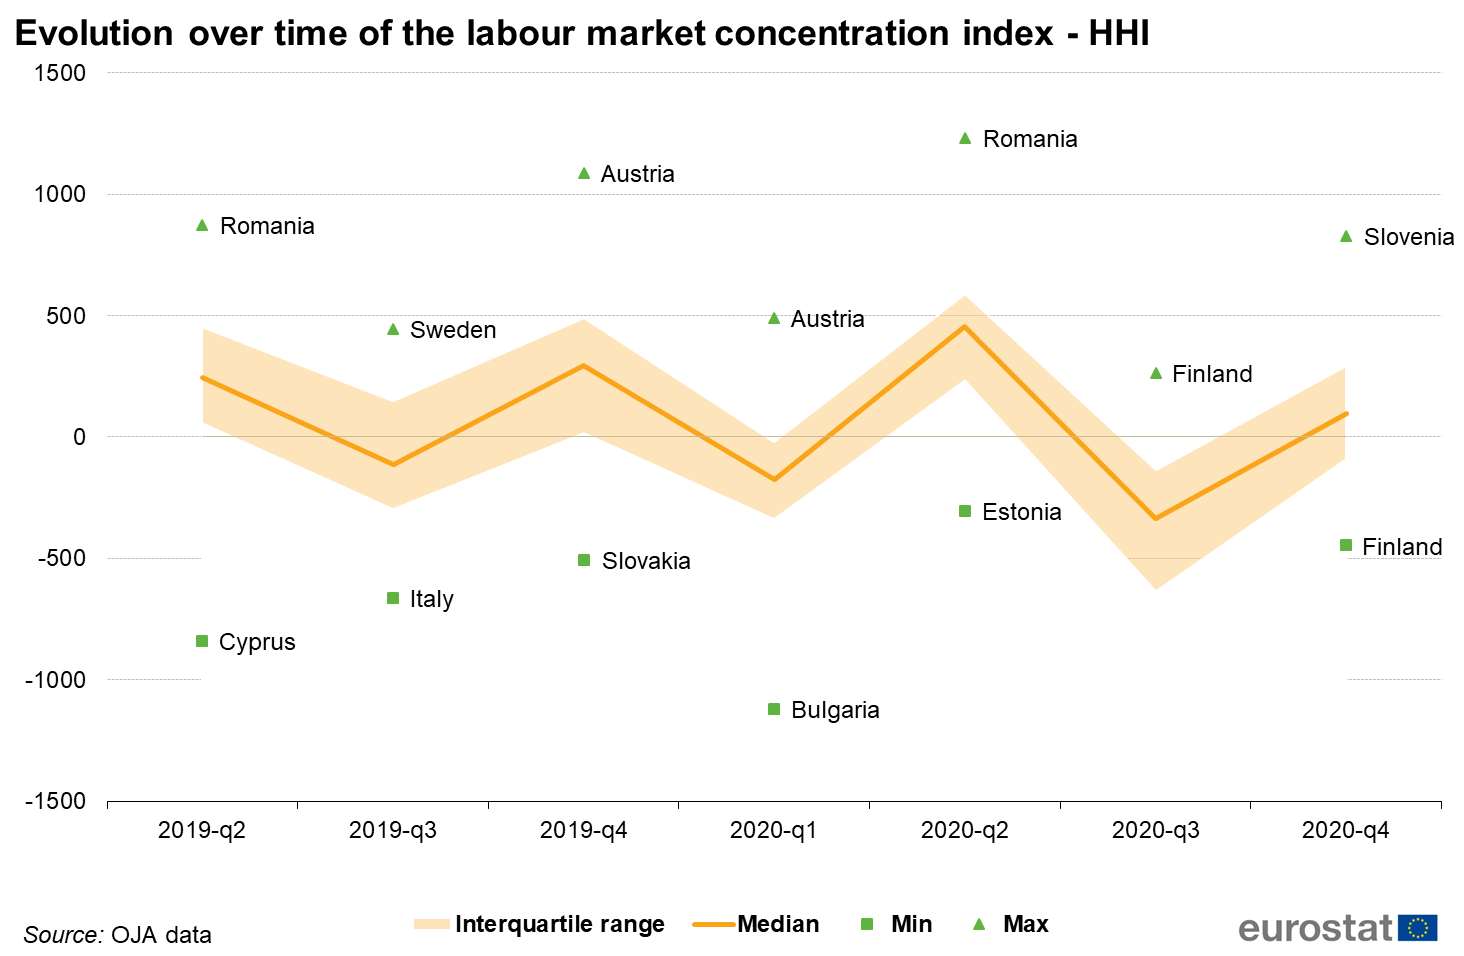
Evolution over time of the labour market concentration index - HHI .png
(
file
)
84 KB
1
09:30, 27 July 2021
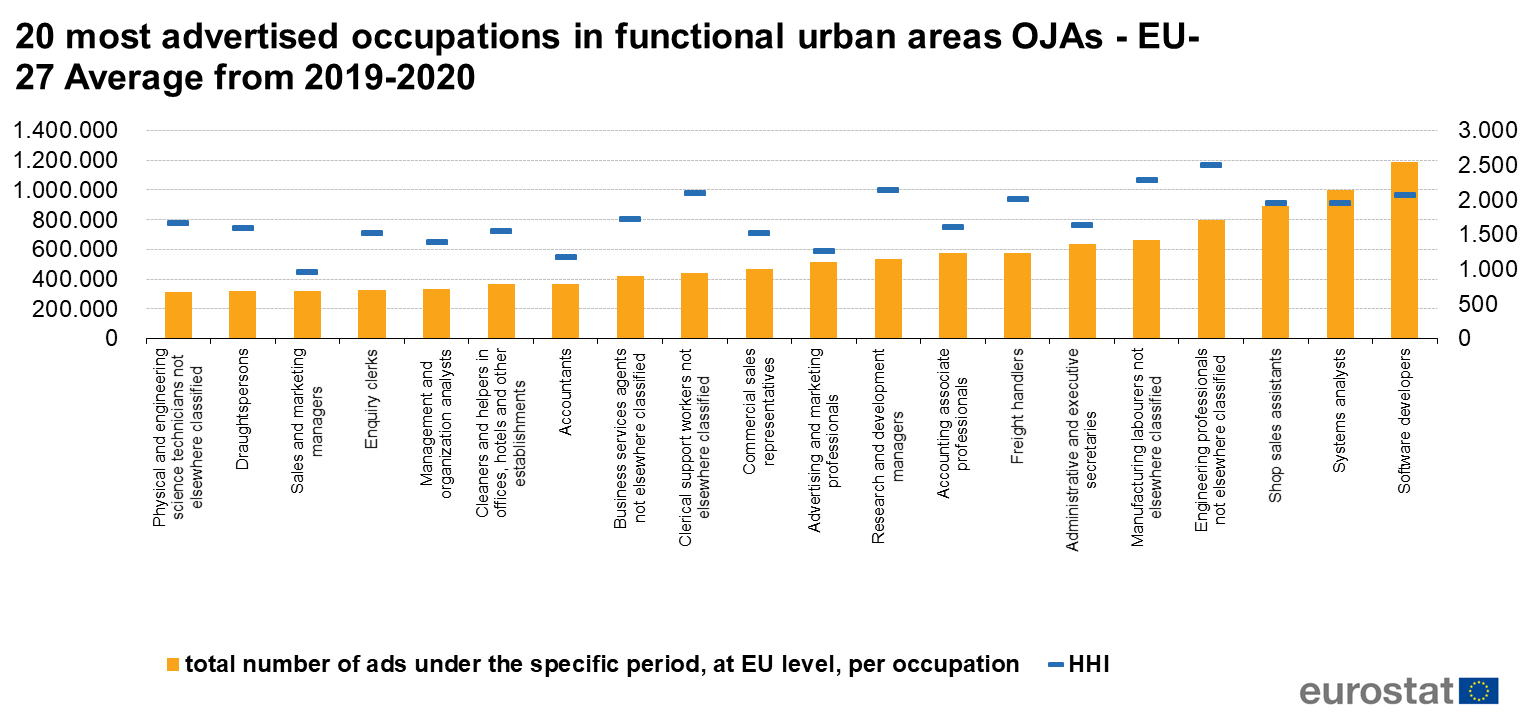
20 most advertised occupations in functional urban areas OJAs - EU-27 Average from 2019-2020.png
(
file
)
114 KB
1
08:31, 27 July 2021
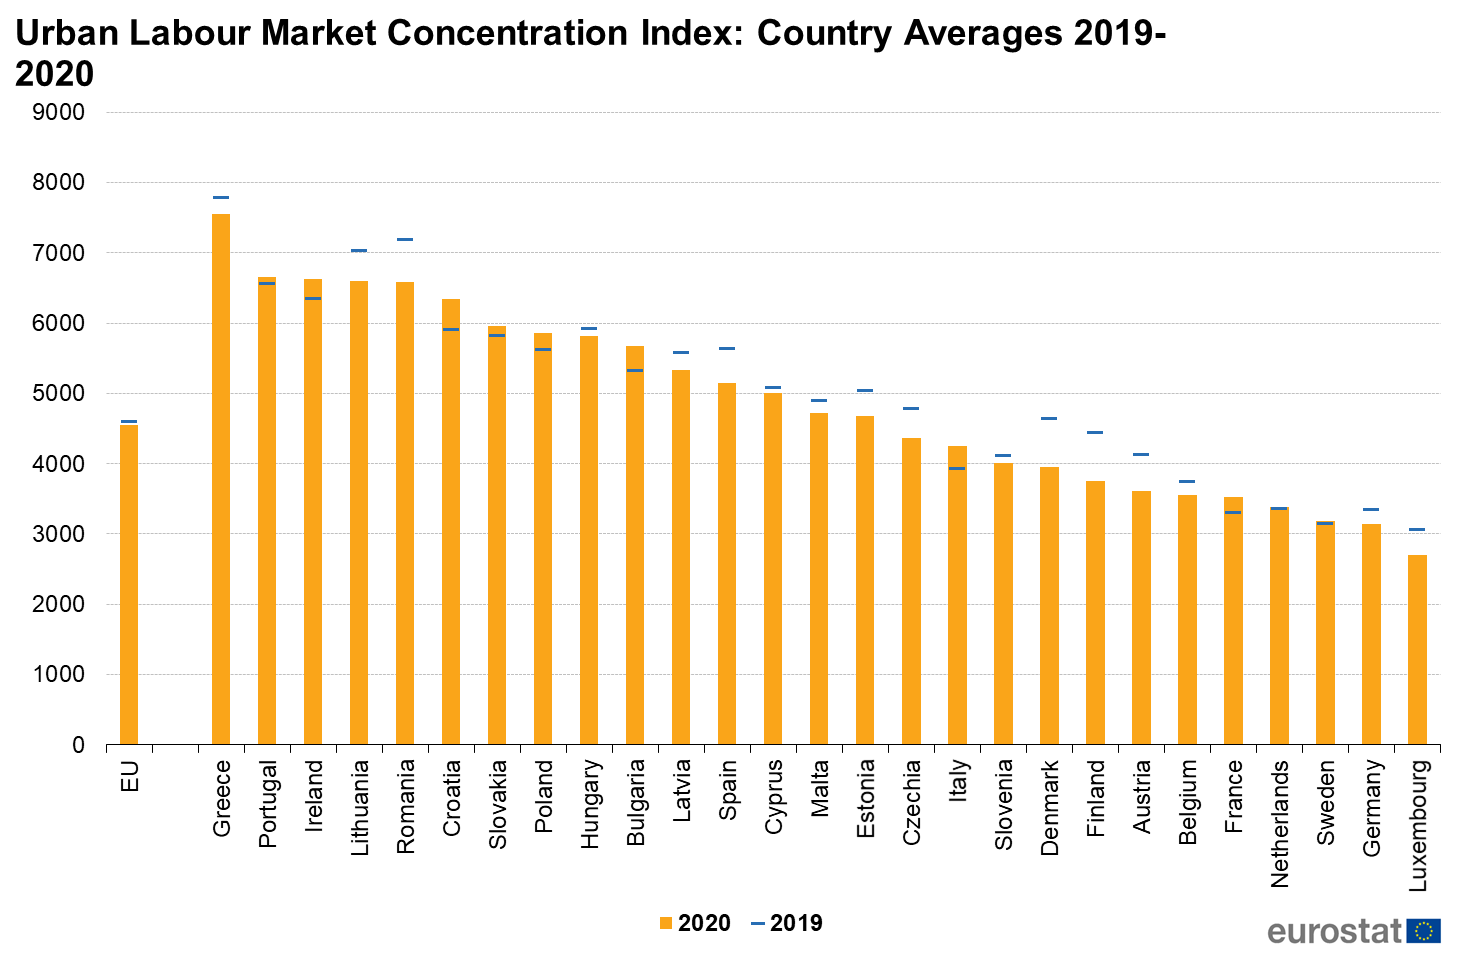
Urban Labour Market Concentration Index Country Averages 2019 2020.png
(
file
)
123 KB
2
13:58, 26 July 2021
Oja hhi results published SE.xlsx
(
file
)
2.12 MB
1
16:41, 23 July 2021
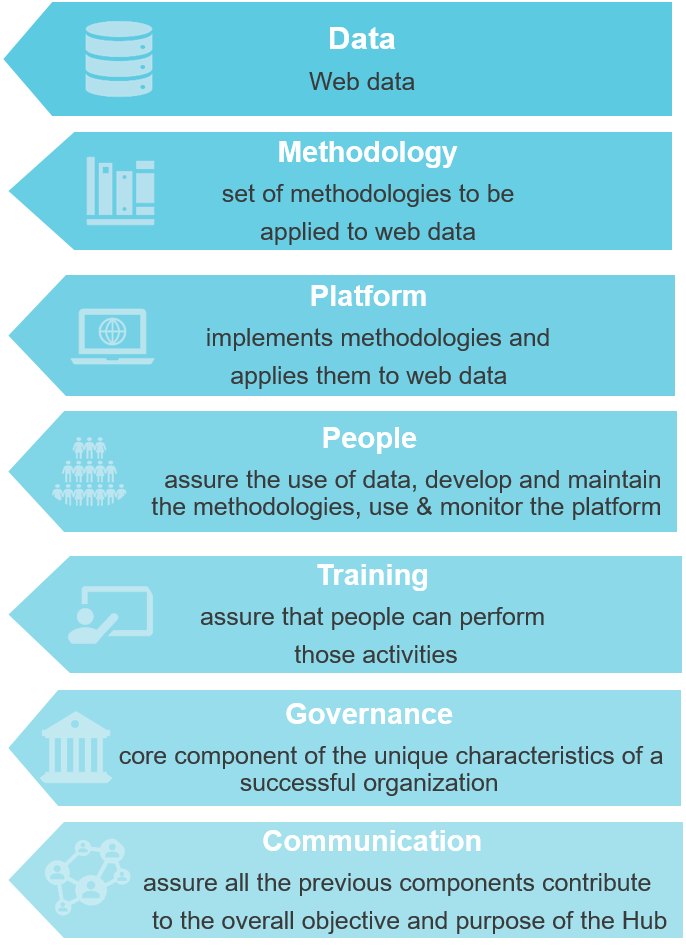
WIHcomponents.png
(
file
)
112 KB
1
14:26, 23 July 2021
Data-pipeline.png
(
file
)
110 KB
1
14:18, 22 July 2021
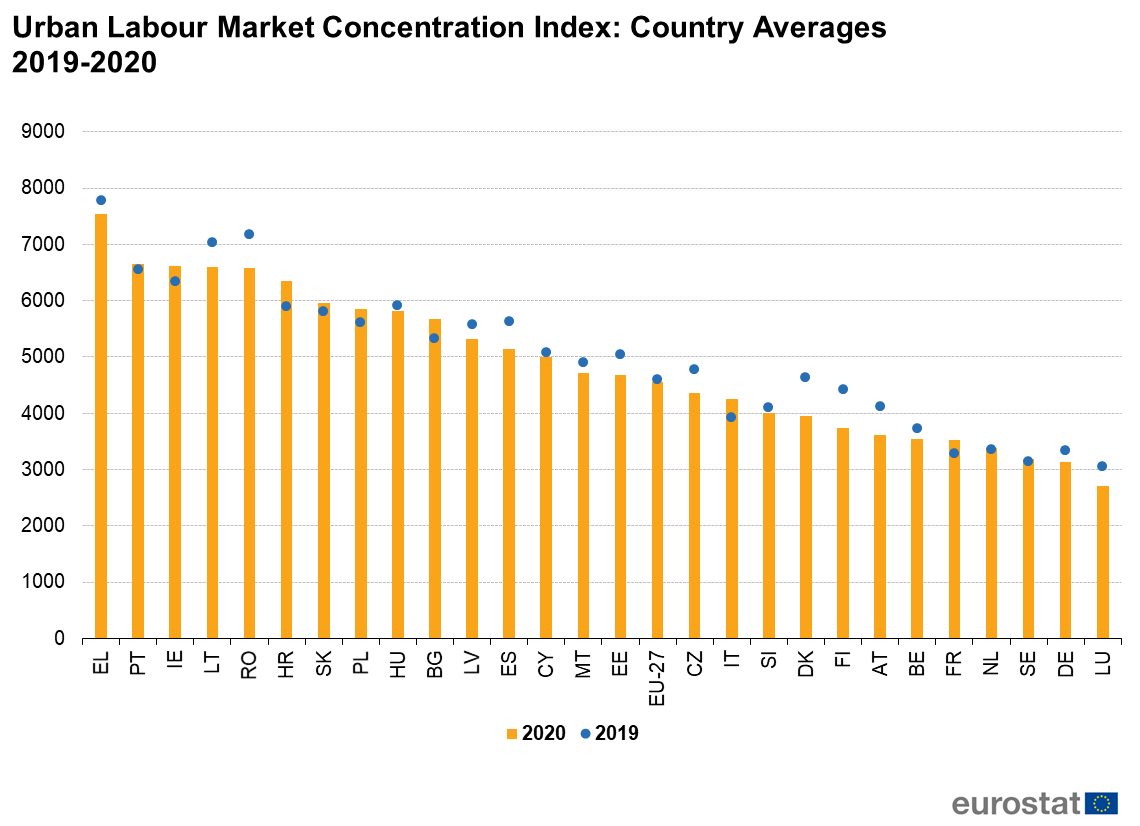
Urban Labour Market Concentration Index Country Averages 2019-2020.png
(
file
)
80 KB
1
14:09, 22 July 2021
MicrosoftTeams-image.png
(
file
)
80 KB
1
Special page
ISSN 2443-8219

_with_lowest_HHI_in_all_EU_countries,_using_OJAs_data,_2020_Country.png)

_(HHI)_change_over_the_previous_quarter.png)
_vs_average_national_(HHI).png)
_with_lowest_HHI_in_all_EU_countries,_using_OJAs_data,_2020_Country_V2.png)
,_2020_Functional_Urban_Area.png)
_vs_average_national_Herfindahl_Hirschman_Index_(HHI).png)

_-_Herfindahl_Hirschman_Index_(HHI)_.png)
_Country_Averages_2019-2020.png)
_in_terms_of_average_HHI_index_,_2020.png)
_with_lowest_HHI_index_in_all_european_countries,_using_OJA_data,_2020.png)


