Tutorials
Log in
Statistics Explained
menu
search
search
Navigation
Main page
Statistical themes
Glossary
Categories
Statistics 4 beginners
Tutorials
Help
Eurostat home
Education corner
Online publications
Regional yearbook
Sustainable development
Full list
Tools
User contributions
Logs
View user groups
Special pages
search
Navigation
Main page
Statistical themes
Glossary
Categories
Statistics 4 beginners
Tutorials
Help
Eurostat home
Education corner
Online publications
Regional yearbook
Sustainable development
Full list
Tools
User contributions
Logs
View user groups
Special pages
Navigation
Main page
Statistical themes
Glossary
Categories
Statistics 4 beginners
Tutorials
Help
Eurostat home
Education corner
Online publications
Regional yearbook
Sustainable development
Full list
Tools
User contributions
Logs
View user groups
Special pages
Uploads by WikiSysop
This special page shows all uploaded files.
File list
Items per page:
20
50
100
250
500
Search for media name:
Username:
Include old versions of files
Go
First page
Previous page
Next page
Last page
Date
Name
Thumbnail
Size
Description
Versions
16:24, 30 April 2009
Tes32dd.PNG
(
file
)
14 KB
1
16:43, 30 April 2009
2006-2007 growth in total passenger air transport by Member State (in %).PNG
(
file
)
14 KB
1
16:43, 30 April 2009
Overview of EU-27 air passenger transport by Member States in 2007 passengers carried (in 1000).PNG
(
file
)
102 KB
1
16:46, 30 April 2009
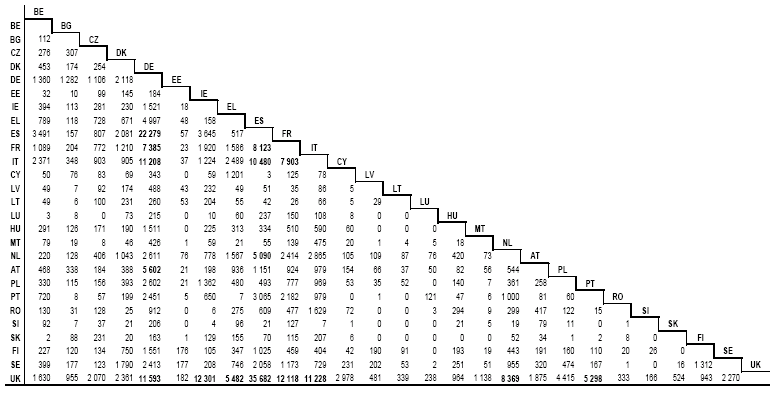
Intra-EU-27 country to country flows in 2007 (in 1000 passengers).PNG
(
file
)
41 KB
1
16:48, 30 April 2009
Extra-EU-27 transport of passengers in 2007 share of world regions in extra-EU-27 transport.PNG
(
file
)
140 KB
1
17:03, 30 April 2009
International extra-EU passenger transport by world region in 2007.PNG
(
file
)
38 KB
1
17:05, 30 April 2009
Structure of European airports by size, on the basis of passenger transport, 2007.PNG
(
file
)
81 KB
1
17:12, 30 April 2009
Top 10 airports in terms of growth between 2006 and 2007.PNG
(
file
)
23 KB
2
17:16, 30 April 2009
Top airports in the EU-27 in terms of total passengers handled in 2007.PNG
(
file
)
96 KB
1
17:18, 30 April 2009
Top 20 airport pairs within the EU-27 in 2007.PNG
(
file
)
53 KB
1
17:20, 30 April 2009
Top 20 extra-EU-27 airport pairs in 2007.PNG
(
file
)
55 KB
1
17:22, 30 April 2009
Top-10 airport pairs in terms of growth between 2006 and 2007 (routes with more than 100 000 passengers in 2007).PNG
(
file
)
26 KB
1
17:25, 30 April 2009
Monthly EU-27 passenger transport by type of transport in 2007 (in 1000 passengers).PNG
(
file
)
22 KB
1
17:26, 30 April 2009
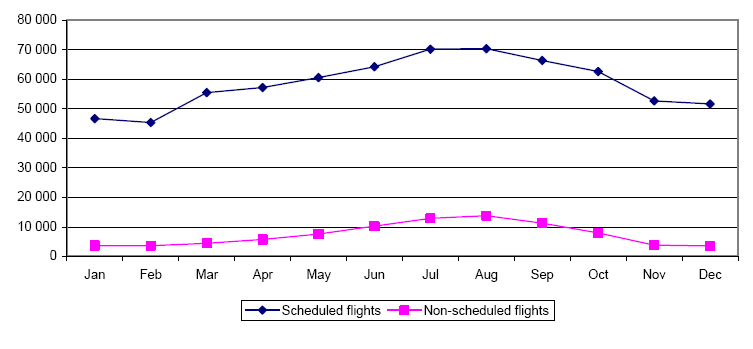
Monthly EU-27 passenger transport by type of flight in 2007 (in 1000 passengers).PNG
(
file
)
19 KB
1
17:28, 30 April 2009
Overview of air passenger transport in Candidate and EFTA countries in 2007.PNG
(
file
)
43 KB
1
17:30, 30 April 2009
Top 3 airports in Candidate and EFTA countries in 2007 (in 1000 passengers).PNG
(
file
)
43 KB
1
13:47, 5 May 2009
EU and other major players in international motor cars trade in 2006 (EUR billion).PNG
(
file
)
25 KB
1
13:50, 5 May 2009
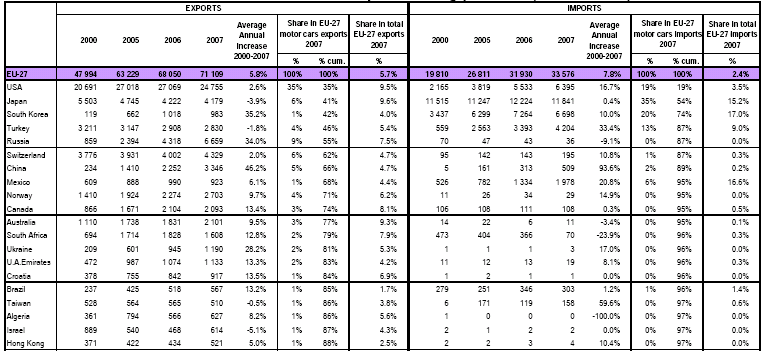
Extra-EU-27 trade in motor cars with top 20 trading partners (EUR million).PNG
(
file
)
47 KB
1
13:52, 5 May 2009
Extra-EU-27 trade in total road vehicles (EUR billion).PNG
(
file
)
37 KB
1
13:54, 5 May 2009
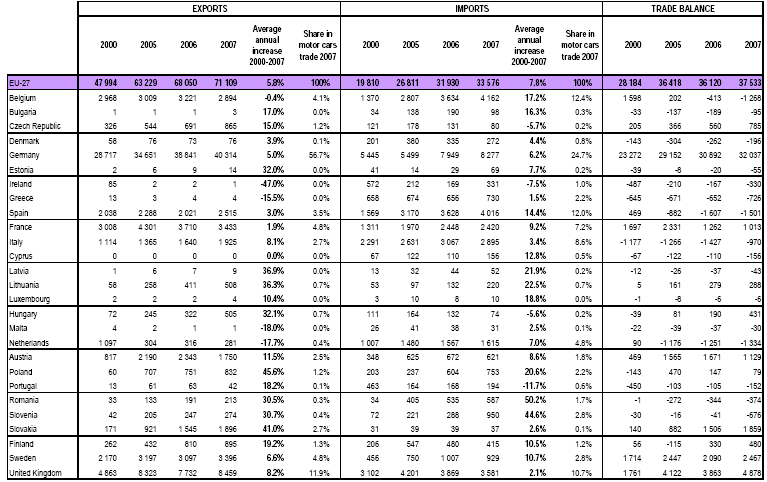
Extra-EU-27 trade in total motor cars (EUR million).PNG
(
file
)
58 KB
1
17:03, 6 May 2009
Share of persons employed, by economic activity, by gender and full-time-part-time, EU-27 (2007).PNG
(
file
)
70 KB
1
17:09, 6 May 2009
Number of persons employed, by economic activity (2007) – in thousands.PNG
(
file
)
36 KB
1
17:15, 6 May 2009
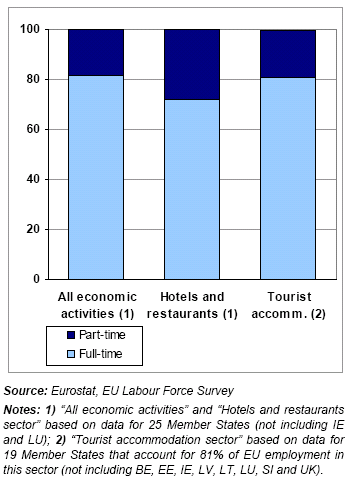
Share of persons employed, by economic activity and full-time-part-time, EU-27 (2007).PNG
(
file
)
22 KB
1
17:21, 6 May 2009
Share of persons employed, by economic activity and full-time - part-time (2007).PNG
(
file
)
42 KB
1
17:24, 6 May 2009
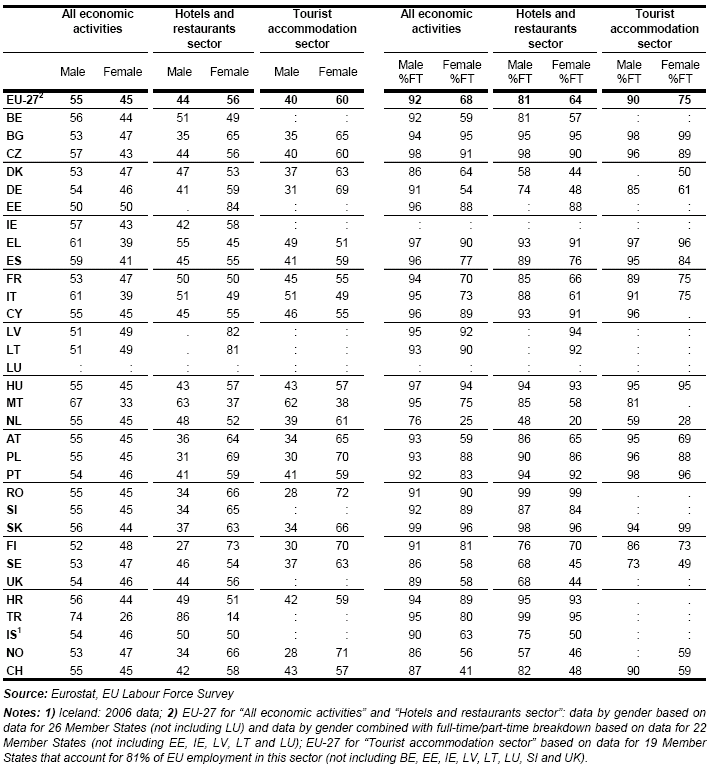
Share of persons employed, by economic activity, by gender and full-time-part-time (2007).PNG
(
file
)
78 KB
1
17:28, 6 May 2009
Share of persons employed, by economic activity and by age group, EU-27 (2007).PNG
(
file
)
39 KB
1
17:31, 6 May 2009
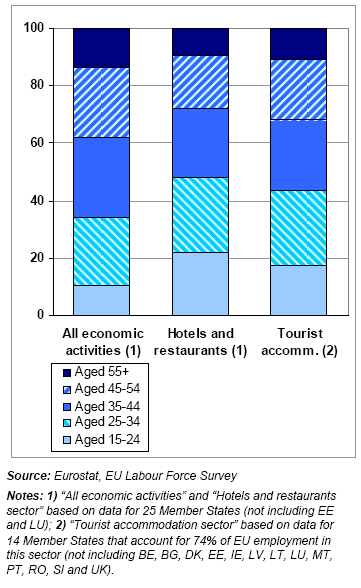
Share of persons employed, by economic activity and by age group (2007).PNG
(
file
)
74 KB
1
17:35, 6 May 2009
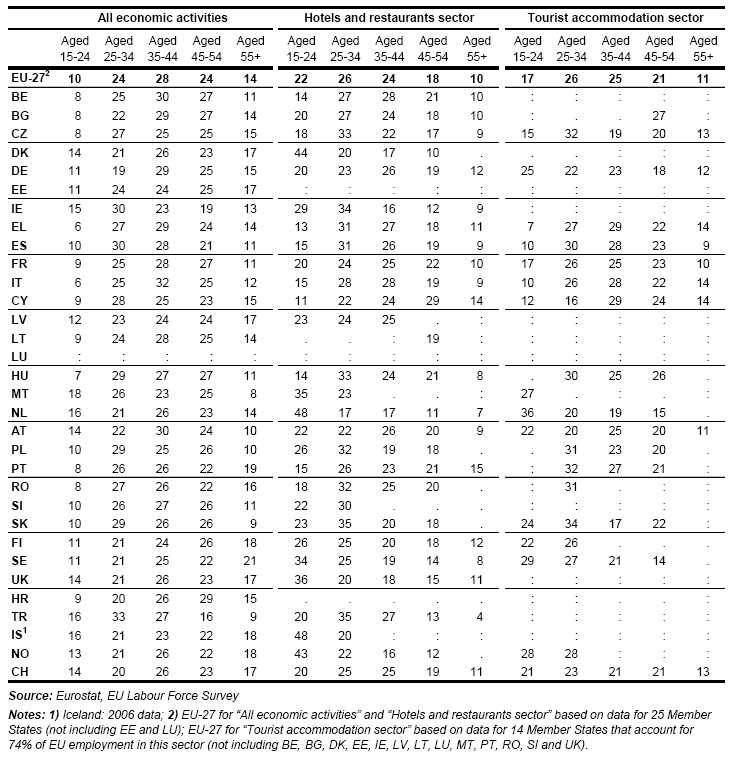
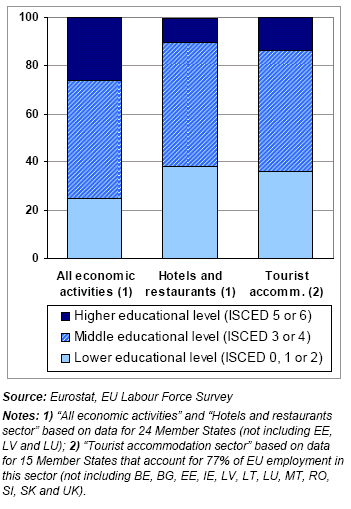
Share of persons employed, by economic activity and by educational level (2007).PNG
(
file
)
59 KB
1
17:47, 6 May 2009
Share of persons employed, by economic activity and by educational level, EU-27 (2007).PNG
(
file
)
42 KB
1
17:50, 6 May 2009
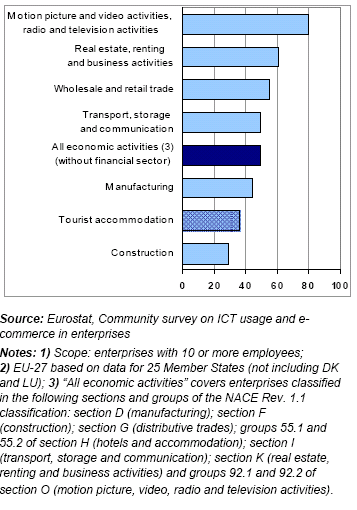
Share of employees1 using computers in their daily work, by economic activity, EU-272 (2007).PNG
(
file
)
38 KB
1
11:36, 7 May 2009
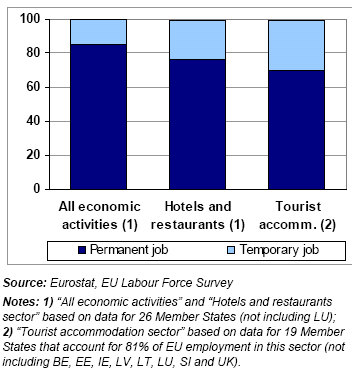
Share of employees, by economic activity and by duration of job, EU-27 (2007).PNG
(
file
)
22 KB
1
11:39, 7 May 2009
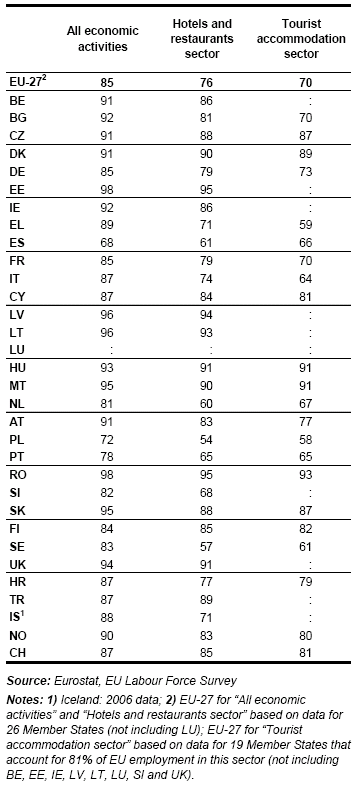
Share of employees having a permanent job, by economic activity (2007).PNG
(
file
)
37 KB
1
11:42, 7 May 2009
Average stay with the same employer (in months), by economic activity (2007).PNG
(
file
)
38 KB
1
11:44, 7 May 2009
Seasonal variation in occupancy of collective tourist accommodation1, monthly data (2007) – in thousands.PNG
(
file
)
54 KB
1
11:48, 7 May 2009
Seasonal variation (quarterly variation compared with the annual average)1 in occupancy of collective tourist accommodation3 and in employment in the tourist accommodation sector (2007).PNG
(
file
)
125 KB
1
11:50, 7 May 2009
Seasonal variation1 in occupancy of collective tourist accommodation2 and of employment in the tourist accommodation sector, EU-273 (2007).PNG
(
file
)
43 KB
1
11:54, 7 May 2009
Seasonal variation1 in employment in the tourist accommodation sector, full-time part-time breakdown, EU-272 (2007).PNG
(
file
)
21 KB
1
11:57, 7 May 2009
Regional unemployment rates compared with the national unemployment rate for NUTS2 regions2 with the highest number of tourism nights per inhabitant (2007).PNG
(
file
)
64 KB
1
12:00, 7 May 2009
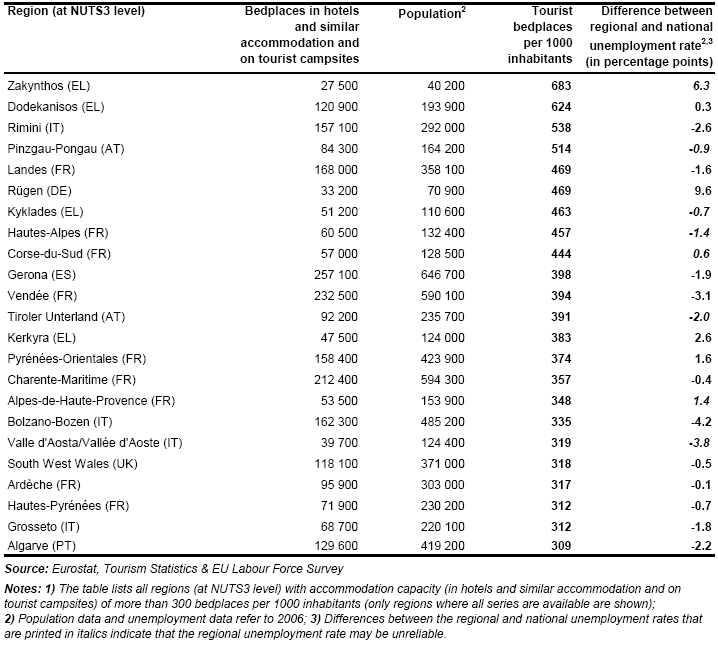
Regional unemployment rates compared with the national unemployment rate for NUTS3 regions1 with the highest number of tourist bedplaces per inhabitant (2007).PNG
(
file
)
72 KB
1
12:02, 7 May 2009
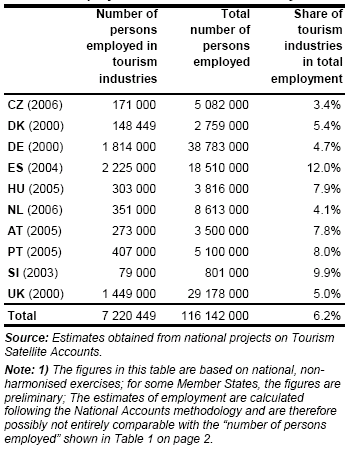
Employment in the tourism industry1.PNG
(
file
)
35 KB
1
14:10, 28 May 2009
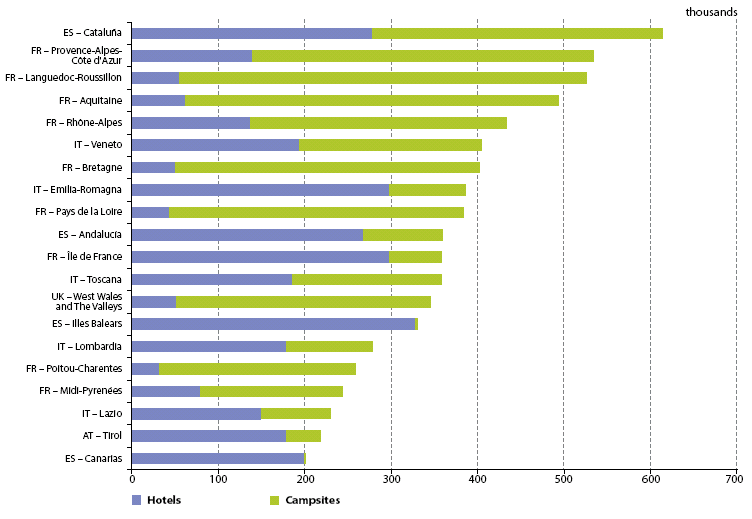
Top 20 EU-27 tourist regions, number of bed-places by type of accommodation, by NUTS 2 regions, 2006.PNG
(
file
)
27 KB
1
14:55, 28 May 2009
Top 20 EU-27 tourist regions, number of arrivals in hotels and campsites, by NUTS 2 regions, 2006.PNG
(
file
)
25 KB
1
14:57, 28 May 2009
Arrivals in hotels and campsites, by NUTS 2 regions, 2006.PNG
(
file
)
502 KB
1
15:02, 28 May 2009
Top 20 EU-27 tourist regions, number of nights spent in hotels and campsites, by NUTS 2 regions, 2006 Breakdown by residents and non residents.PNG
(
file
)
27 KB
1
15:05, 28 May 2009
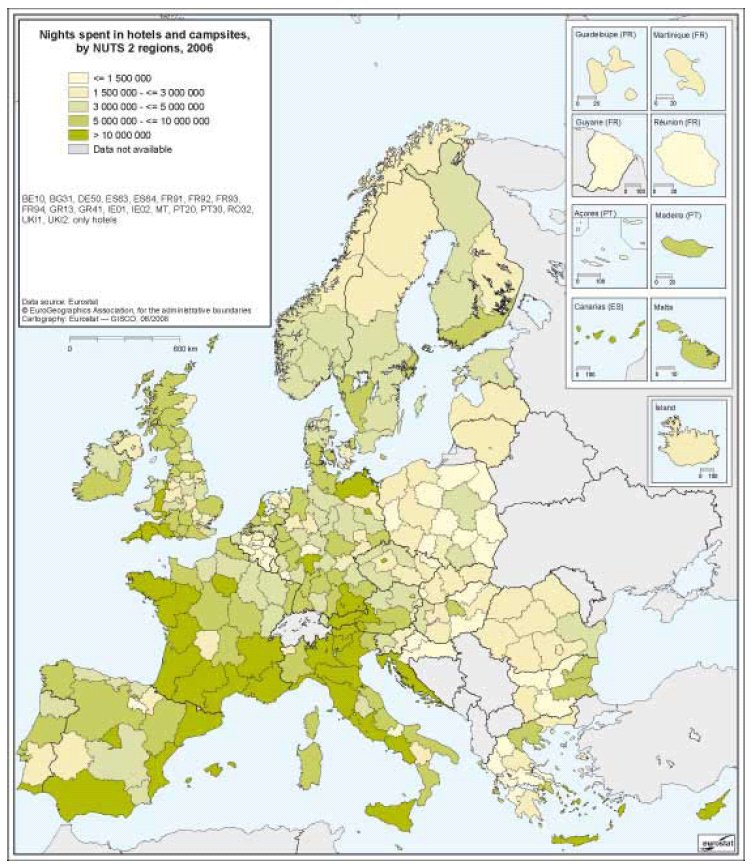
Nights spent in hotels and campsites, by NUTS 2 regions, 2006.PNG
(
file
)
500 KB
1
15:06, 28 May 2009
Nights spent in hotels and campsites, EU-27, average annual change rate 2000–06 Percentage.PNG
(
file
)
25 KB
1
15:09, 28 May 2009
Night spent in hotels and campsites per 1 000 inhabitants, by NUTS 2 regions, 2006.PNG
(
file
)
499 KB
1
15:11, 28 May 2009
Nights spent in hotels and campsites, by NUTS 2 regions, average annual change rate 2000 to 2006 Percentage.PNG
(
file
)
498 KB
1
15:13, 28 May 2009
Share of non-resident nights spent in hotels and campsites, by NUTS 2 regions, 2006.PNG
(
file
)
500 KB
1
15:15, 28 May 2009
Nights spent in campsites, by NUTS 2 regions, 2006.PNG
(
file
)
489 KB
1
First page
Previous page
Next page
Last page
Special page
ISSN 2443-8219

.PNG)
.PNG)
.PNG)


.PNG)
.PNG)
.PNG)

.PNG)
.PNG)
.PNG)
.PNG)
.PNG)
.PNG)
_%E2%80%93_in_thousands.PNG)
.PNG)
.PNG)
.PNG)
.PNG)
.PNG)
.PNG)
.PNG)
.PNG)
.PNG)
.PNG)
,_by_economic_activity_(2007).PNG)
_%E2%80%93_in_thousands.PNG)
1_in_occupancy_of_collective_tourist_accommodation3_and_in_employment_in_the_tourist_accommodation_sector_(2007).PNG)
.PNG)
.PNG)
.PNG)
.PNG)


