Tutorials
Log in
Statistics Explained
menu
search
search
Navigation
Main page
Statistical themes
Glossary
Categories
Statistics 4 beginners
Tutorials
Help
Eurostat home
Education corner
Online publications
Regional yearbook
Sustainable development
Full list
Tools
User contributions
Logs
View user groups
Special pages
search
Navigation
Main page
Statistical themes
Glossary
Categories
Statistics 4 beginners
Tutorials
Help
Eurostat home
Education corner
Online publications
Regional yearbook
Sustainable development
Full list
Tools
User contributions
Logs
View user groups
Special pages
Navigation
Main page
Statistical themes
Glossary
Categories
Statistics 4 beginners
Tutorials
Help
Eurostat home
Education corner
Online publications
Regional yearbook
Sustainable development
Full list
Tools
User contributions
Logs
View user groups
Special pages
Uploads by Vasilpa
This special page shows all uploaded files.
File list
Items per page:
20
50
100
250
500
Search for media name:
Username:
Include old versions of files
Go
First page
Previous page
Next page
Last page
Date
Name
Thumbnail
Size
Description
Versions
13:06, 12 November 2009
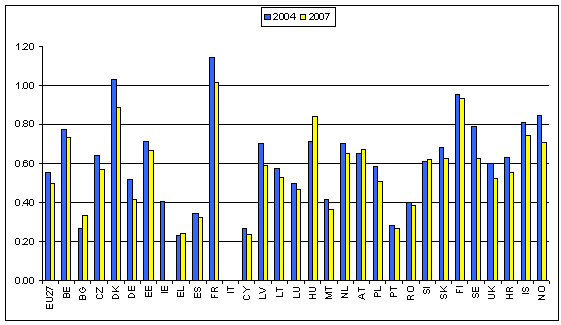
Total turnover from the domestic postal sector as % of GDP 2004 2007.PNG
(
file
)
9 KB
1
13:15, 12 November 2009
Total number of persons employed in the domestic postal sector as % of the total employment 2004 2007.PNG
(
file
)
11 KB
1
16:38, 12 November 2009
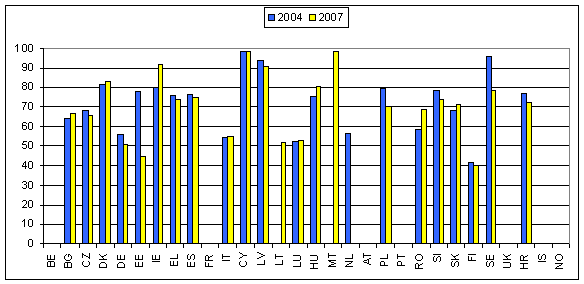
Number of people served by one post office (including postal agencies, postal outlets, as well as mobile post offices 2004 2007.PNG
(
file
)
8 KB
1
17:17, 12 November 2009
Number of letter-post items sent per capita (2004, 2007).PNG
(
file
)
9 KB
1
17:24, 12 November 2009
Number of letter-post items (in 1000) distributed per person employed 2004 2007.PNG
(
file
)
9 KB
1
17:37, 12 November 2009
Ordinary letters and postcards as % of the total letter-post services.PNG
(
file
)
11 KB
1
17:42, 12 November 2009
Ordinary letters and postcards as % of the total letter-post services 2004 2007.PNG
(
file
)
11 KB
1
18:02, 12 November 2009
Reserved area as % of the total letter-post services 2004 2007.PNG
(
file
)
10 KB
2
18:10, 12 November 2009
Percentage of priority letters delivered on-time according to national performance indicators (domestic services), 2004-2007.PNG
(
file
)
11 KB
1
18:24, 12 November 2009
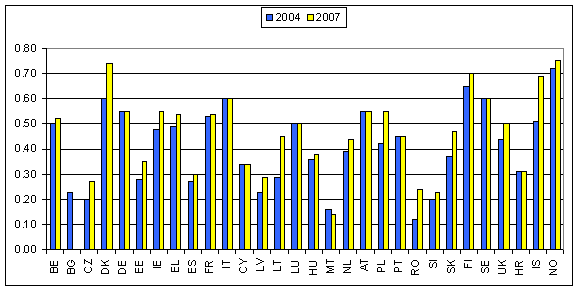
List price (EUR) for a standard (1st class) letter weighing less than 20 g (universal service) for domestic services 2004 2007.PNG
(
file
)
10 KB
1
18:35, 12 November 2009
List price (EUR) for a standard (1st class) letter weighing less than 20 g (universal service) for Intra-EU services 2004 2007.PNG
(
file
)
9 KB
1
18:46, 12 November 2009
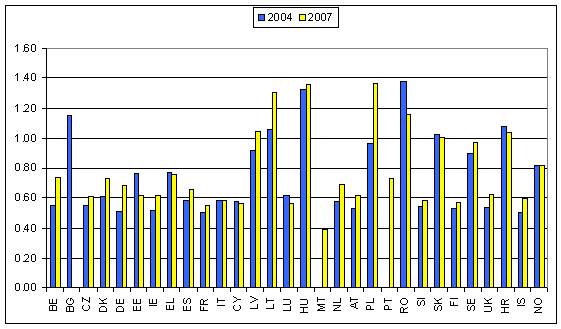
List price for standard (1st class) letter weighing less than 20 g (universal service) for domestic services in Purchasing Power Parities (PPPs) 2004 2007.PNG
(
file
)
11 KB
1
18:58, 12 November 2009
List price for standard (1st class) letter weighing less than 20 g (universal service) for Intra-EU services in Purchasing Power Parities (PPPs) 2004 2007.PNG
(
file
)
10 KB
1
10:51, 13 November 2009
Number of people served by one post office (including postal agencies, postal outlets, as well as mobile post offices) 2004 2007.PNG
(
file
)
8 KB
2
11:01, 13 November 2009
Access points 2007.PNG
(
file
)
27 KB
1
11:37, 13 November 2009
Selected indicators of the European postal market 2004-2007.PNG
(
file
)
50 KB
1
17:17, 19 November 2009
Selected indicators of the European postal market (continued), 2004-2007.PNG
(
file
)
67 KB
2
17:33, 19 November 2009
Indicators of the European postal market 2004-2007.PNG
(
file
)
65 KB
2
11:34, 7 July 2011
Selected indicators of the European postal market 2004-2009.PNG
(
file
)
79 KB
2
11:42, 7 July 2011
Selected indicators of the European postal market (continued), 2004-2009.PNG
(
file
)
54 KB
1
13:10, 7 July 2011
Indicators of the European postal market, 2004-2009.PNG
(
file
)
59 KB
1
13:15, 7 July 2011
Total turnover from the domestic postal sector as % of GDP.PNG
(
file
)
18 KB
2
13:18, 7 July 2011
Total number of persons employed in the domestic postal sector as % of the total employment.PNG
(
file
)
19 KB
1
13:22, 7 July 2011
Number of people served by one post office (including postal agencies, postal outlets, as well as mobile post offices) (2004, 2009).PNG
(
file
)
19 KB
1
13:26, 7 July 2011
Access points 2009.PNG
(
file
)
27 KB
1
13:30, 7 July 2011
Number of letter-post items sent per capita (2004, 2009).PNG
(
file
)
16 KB
1
13:33, 7 July 2011
Number of letter-post items (in 1000) distributed per person employed (2004, 2009).PNG
(
file
)
17 KB
1
13:36, 7 July 2011
Ordinary letters and postcards as % of the total letter-post services (2004, 2009).PNG
(
file
)
20 KB
1
13:39, 7 July 2011
Reserved area as % of the total letter-post services (2004, 2009).PNG
(
file
)
21 KB
1
13:42, 7 July 2011
Percentage of priority letters delivered on-time according to national performance indicators (domestic services) (2004, 2009).PNG
(
file
)
20 KB
1
13:45, 7 July 2011
List price (EUR) for a standard (1st class) letter weighing less than 20 g (universal service) for domestic services (2004, 2009).PNG
(
file
)
19 KB
1
13:48, 7 July 2011
List price (EUR) for a standard (1st class) letter weighing less than 20 g (universal service) for intra-EU services (2004, 2009).PNG
(
file
)
19 KB
1
13:54, 7 July 2011
List price for a standard (1st class) letter weighing less than 20 g (universal service) for domestic services based on Purchasing Power Parities (PPPs) (2004, 2009).PNG
(
file
)
17 KB
1
13:57, 7 July 2011
List price for a standard (1st class) letter weighing less than 20 g (universal service) for intra-EU services based on Purchasing Power Parities (PPPs) (2004, 2009).PNG
(
file
)
17 KB
1
14:16, 24 November 2011
Telecommunications YB2012 rev.xls
(
file
)
85 KB
1
17:46, 14 November 2012
Enterprises using the internet in contact with public authorities, by purpose of use, January 2011.png
(
file
)
38 KB
Reverted to version as of 12:31, 14 November 2012
5
18:02, 5 December 2013
Individuals who used the internet on average at least once a week, by age group and level of formal education, EU28, 2013 (% of individuals).png
(
file
)
8 KB
1
18:11, 5 December 2013
Individuals who have never used the internet, EU28, 2006-2013 (% of individuals).png
(
file
)
9 KB
1
18:28, 5 December 2013
Individuals who have never used the internet, 2013 (% of individuals).png
(
file
)
6 KB
1
18:33, 5 December 2013
Individuals who contacted or interacted with public authorities and services over the internet for private purposes in the last 12 months, 2013 (% of individuals).png
(
file
)
10 KB
1
18:40, 5 December 2013
Purposes of searching and interacting with e-government websites, EU-28, 2013 (% of e-government users).png
(
file
)
10 KB
1
18:44, 5 December 2013
Problems experienced when using websites of public authorities or public services, EU-28, 2013 (% of e-government users) .png
(
file
)
9 KB
1
19:05, 5 December 2013
Satisfaction with websites of public authorities or public services, EU-28, 2013 (% of e-government users) .png
(
file
)
9 KB
1
19:10, 5 December 2013
Problems experienced when using websites of public authorities or public services, EU-28, 2013 (% of e-government users)1.png
(
file
)
9 KB
1
19:12, 5 December 2013
Satisfaction with websites of public authorities or public services, EU-28, 2013 (% of e-government users)1 .png
(
file
)
9 KB
1
19:17, 5 December 2013
Use of internet for communication, by age group, EU28, 2013 (% of internet users).png
(
file
)
6 KB
1
19:22, 5 December 2013
Use of internet for access to information and learning purposes, by age group, EU28, 2013 (% of internet users).png
(
file
)
11 KB
1
19:27, 5 December 2013
Use of internet for civic and political participation, by age group, EU28, 2013 (% of internet users).png
(
file
)
6 KB
1
19:32, 5 December 2013
Internet users who bought or ordered goods or services for private use over the internet in the last 12 months, 2008 and 2013 (% of internet users) .png
(
file
)
9 KB
1
19:39, 5 December 2013
Internet users who bought or ordered goods or services for private use over the internet in the last 12 months, 2008 and 2013 (% of internet users)1 .png
(
file
)
9 KB
1
First page
Previous page
Next page
Last page
Special page
ISSN 2443-8219


.PNG)
_distributed_per_person_employed_2004_2007.PNG)


,_2004-2007.PNG)
_for_a_standard_(1st_class)_letter_weighing_less_than_20_g_(universal_service)_for_domestic_services_2004_2007.PNG)
_for_a_standard_(1st_class)_letter_weighing_less_than_20_g_(universal_service)_for_Intra-EU_services_2004_2007.PNG)
_letter_weighing_less_than_20_g_(universal_service)_for_domestic_services_in_Purchasing_Power_Parities_(PPPs)_2004_2007.PNG)
_letter_weighing_less_than_20_g_(universal_service)_for_Intra-EU_services_in_Purchasing_Power_Parities_(PPPs)_2004_2007.PNG)
_2004_2007.PNG)


,_2004-2007.PNG)


,_2004-2009.PNG)


_(2004,_2009).PNG)

.PNG)
_distributed_per_person_employed_(2004,_2009).PNG)
.PNG)
.PNG)
_(2004,_2009).PNG)
_for_a_standard_(1st_class)_letter_weighing_less_than_20_g_(universal_service)_for_domestic_services_(2004,_2009).PNG)
_for_a_standard_(1st_class)_letter_weighing_less_than_20_g_(universal_service)_for_intra-EU_services_(2004,_2009).PNG)
_letter_weighing_less_than_20_g_(universal_service)_for_domestic_services_based_on_Purchasing_Power_Parities_(PPPs)_(2004,_2009).PNG)
_letter_weighing_less_than_20_g_(universal_service)_for_intra-EU_services_based_on_Purchasing_Power_Parities_(PPPs)_(2004,_2009).PNG)

.png)
.png)
.png)
.png)
.png)
_.png)
_.png)
1.png)
1_.png)
.png)
.png)
.png)
_.png)
1_.png)