Tutorials
Log in
Statistics Explained
menu
search
search
Navigation
Main page
Statistical themes
Glossary
Categories
Statistics 4 beginners
Tutorials
Help
Eurostat home
Education corner
Online publications
Regional yearbook
Sustainable development
Full list
Tools
User contributions
Logs
View user groups
Special pages
search
Navigation
Main page
Statistical themes
Glossary
Categories
Statistics 4 beginners
Tutorials
Help
Eurostat home
Education corner
Online publications
Regional yearbook
Sustainable development
Full list
Tools
User contributions
Logs
View user groups
Special pages
Navigation
Main page
Statistical themes
Glossary
Categories
Statistics 4 beginners
Tutorials
Help
Eurostat home
Education corner
Online publications
Regional yearbook
Sustainable development
Full list
Tools
User contributions
Logs
View user groups
Special pages
Uploads by Smihima
This special page shows all uploaded files.
File list
Items per page:
20
50
100
250
500
Search for media name:
Username:
Include old versions of files
Go
First page
Previous page
Next page
Last page
Date
Name
Thumbnail
Size
Description
Versions
11:11, 10 April 2012
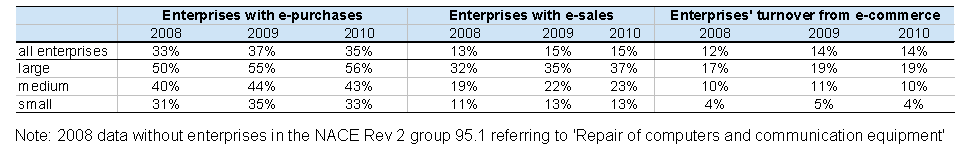
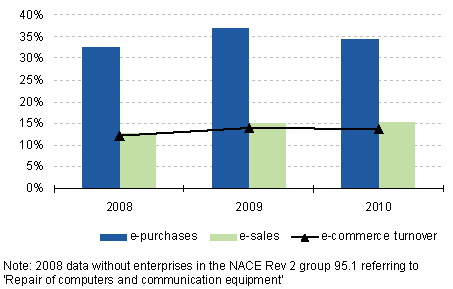
E commerce sales and purchases, turnover from e commerce, by size class, 2008 2010, EU27 (% of enterprises, % of total turnover).png
(
file
)
6 KB
1
11:18, 10 April 2012
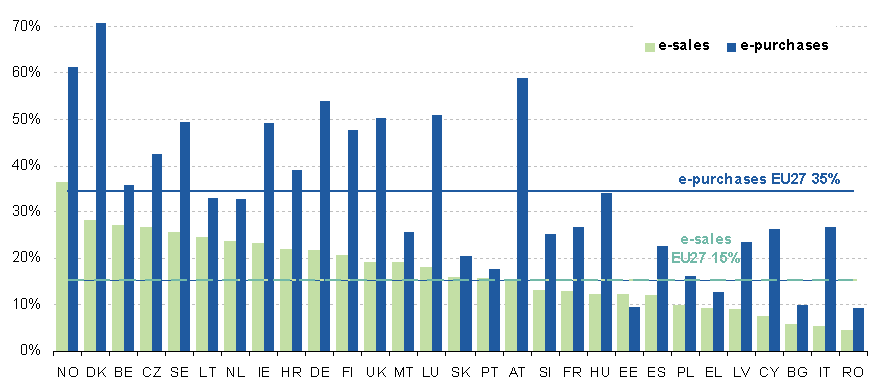
E commerce sales and purchases, 2010 (% of enterprises).png
(
file
)
7 KB
1
13:53, 10 April 2012
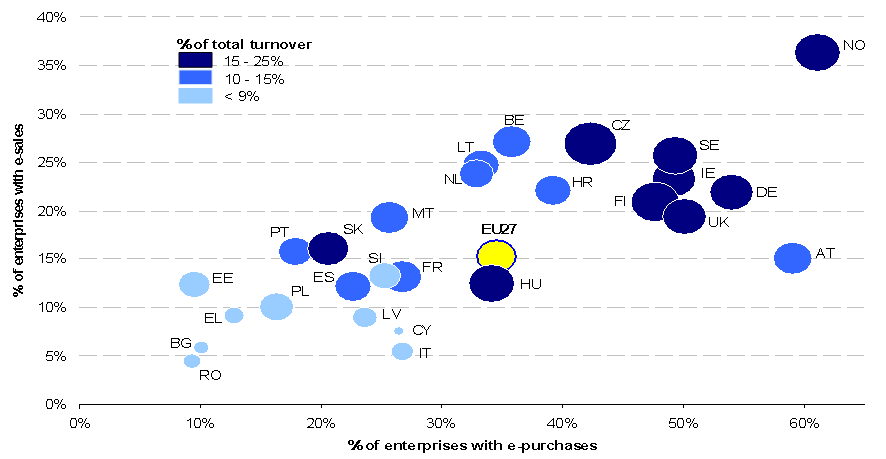
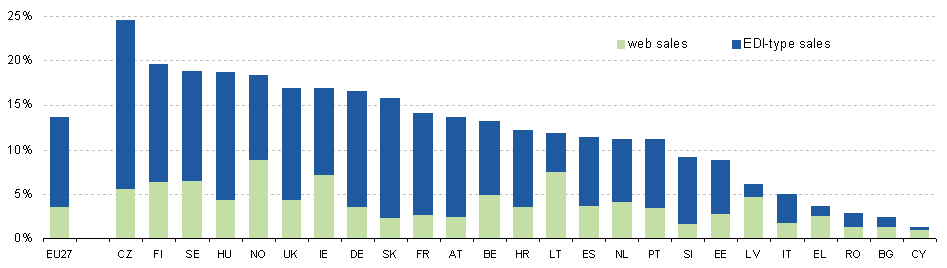
E commerce sales and purchases, turnover from e commerce, 2010 (% of enterprises, % of total turnover).png
(
file
)
9 KB
1
14:15, 10 April 2012
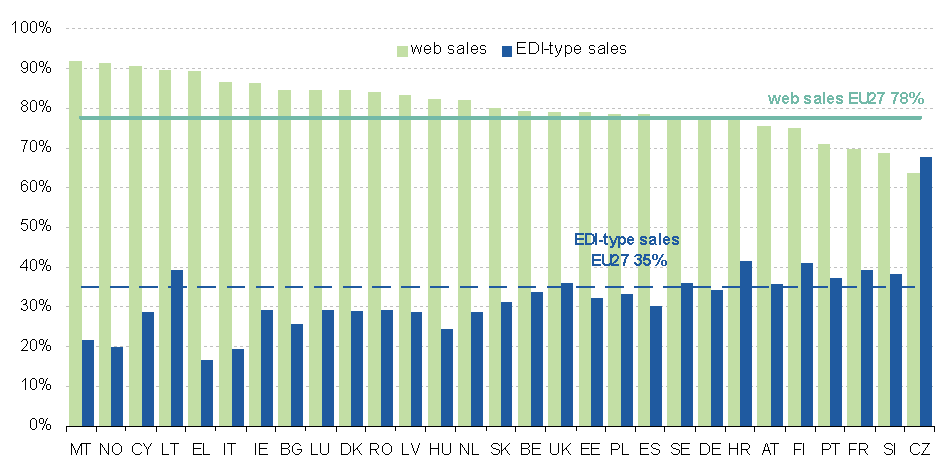
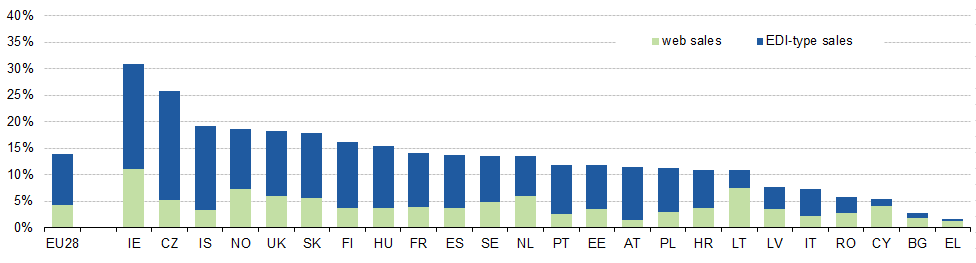
E commerce sales broken down by web and EDI type sales, 2010 (% of enterprises with e sales).png
(
file
)
10 KB
1
14:23, 10 April 2012
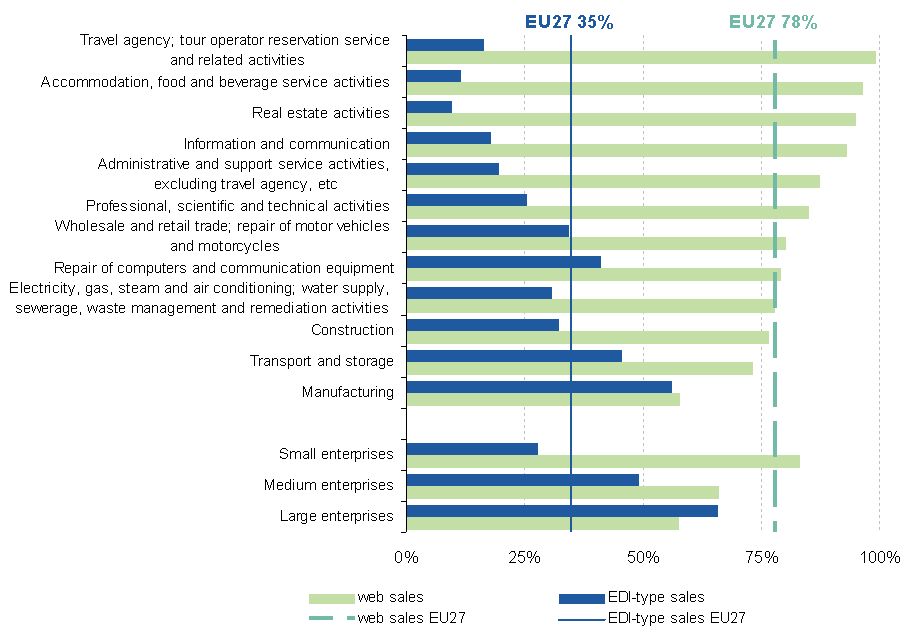
E commerce sales broken down by web and EDI type sales and by economic activity, EU27, 2010 (% of enterprises with e sales).png
(
file
)
15 KB
1
14:38, 10 April 2012
Turnover from e commerce broken down by web and EDI type sales, 2010 (% of total turnover).png
(
file
)
5 KB
1
14:51, 10 April 2012
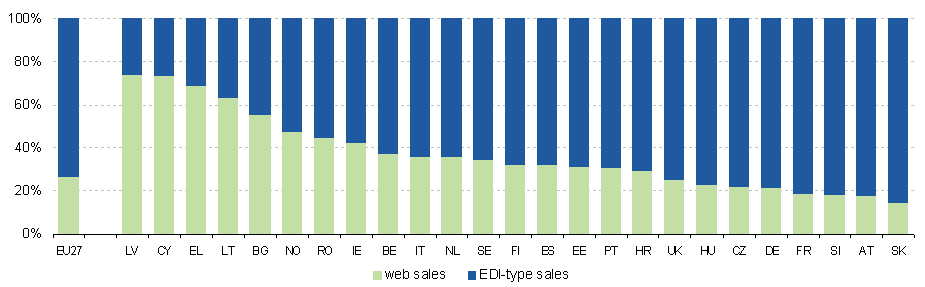
Web sales and EDI type sales, 2010 (% of turnover from e commerce).png
(
file
)
6 KB
1
14:54, 10 April 2012
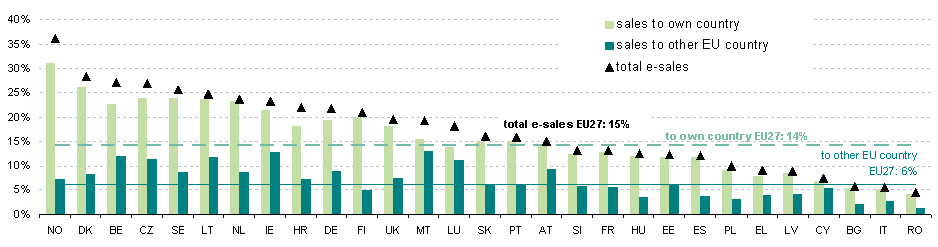
E commerce sales to own country and other EU countries, 2010 (% of enterprises).png
(
file
)
6 KB
1
14:57, 10 April 2012
E commerce purchases from own country and from other EU countries, 2010 (% of enterprises).png
(
file
)
8 KB
1
09:30, 11 April 2012
E commerce sales and purchases, turnover from e commerce, 2008 to 2010, EU27 (% of enterprises, % total turnover).png
(
file
)
4 KB
2
15:05, 11 April 2012
E commerce sales and purchases, turnover from e commerce, 2008 to 2010, EU27 (% of enterprises, % total turnover)v1.png
(
file
)
4 KB
1
11:06, 13 November 2012
Copy of Information society YB2013.xls
(
file
)
794 KB
corrected/commented version for Yearbook 2013
1
13:09, 27 February 2013
Adoption of e business technologies in enterprises, EU27, 2010 and 2012 (% of enterprises).png
(
file
)
5 KB
1
13:14, 27 February 2013
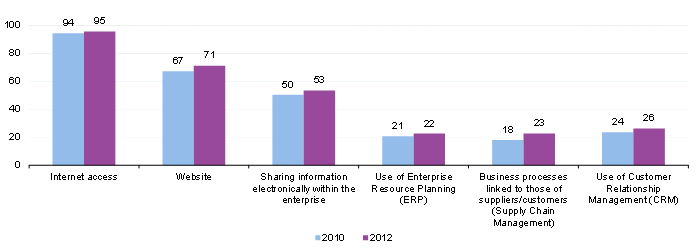
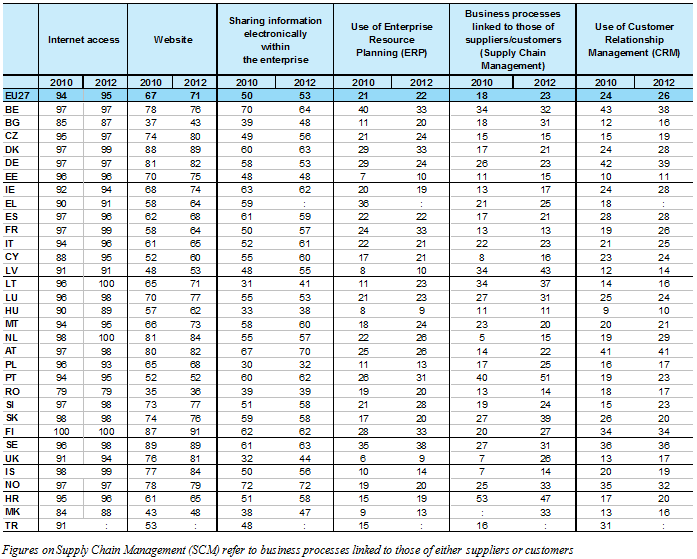
Enterprises adopting technologies for e business, 2010 and 2012 (% of enterprises).png
(
file
)
28 KB
1
15:10, 28 February 2013
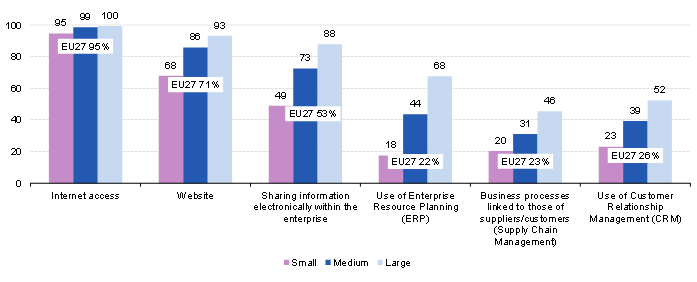
Enterprises adopting technologies for e business, by size class, EU27, 2012 (% of enterprises).png
(
file
)
7 KB
1
15:15, 28 February 2013
Enterprises with Internet access, 2012 (% of enterprises).png
(
file
)
5 KB
1
15:48, 28 February 2013
Enterprises with a website, 2012, (% of enterprises).png
(
file
)
5 KB
1
15:58, 28 February 2013
Persons using computers and accessing the Internet, by enterprise size class, EU27, 2010 and 2012 (% of persons employed).png
(
file
)
4 KB
1
16:26, 28 February 2013
Enterprises sharing information on sales with other business functions, by economic activity, EU27, 2012 (% of enterprises).png
(
file
)
18 KB
1
16:33, 28 February 2013
Enterprises sharing information on purchases with other business functions, by economic activity, EU27, 2012 (% of enterprises).png
(
file
)
13 KB
1
16:41, 28 February 2013
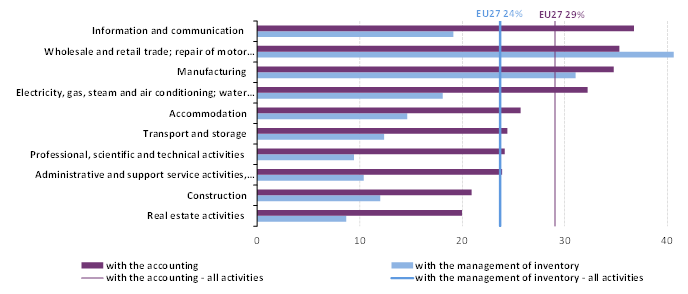
Enterprises sharing information on supply chain management, by economic activity, EU27, 2012 (% of enterprises).png
(
file
)
14 KB
1
16:44, 28 February 2013
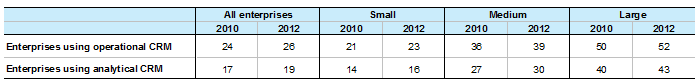
Enterprises using Customer Relationship Management, by enterprise size class, EU27, 2010 and 2012 (% of enterprises).png
(
file
)
4 KB
1
15:25, 1 March 2013
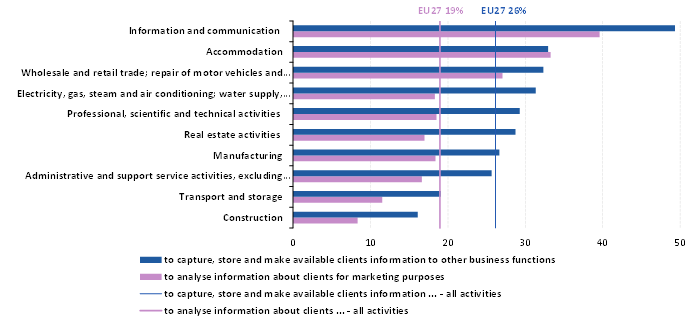
Enterprises using Customer Relationship Management, by economic activity, EU27, 2012 (% of enterprises).png
(
file
)
14 KB
1
15:26, 1 March 2013
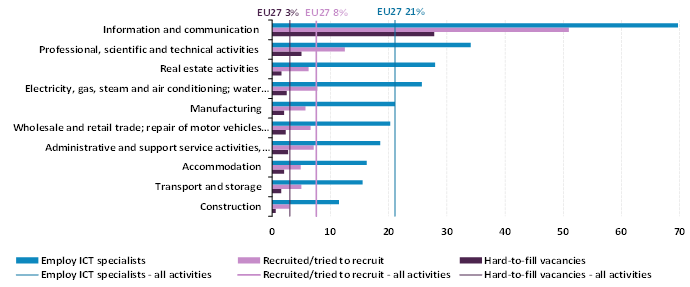
Enterprises employing, recruiting and having hard to fill vacancies for ICT specialists, by economic activity, EU27, 2012 (% of enterprises).png
(
file
)
15 KB
1
15:49, 1 March 2013
ICT specialists in enterprises, 2012 (% of enterprises).png
(
file
)
20 KB
1
15:22, 12 March 2013
Internet access, enterprises with a website, provision of portable devices for mobile connection to the Internet, by size class, EU27, 2012 (% of enterprises).png
(
file
)
11 KB
1
15:29, 12 March 2013
Internet access, fixed broadband connection to the Internet, enterprises providing portable devices for mobile connection to the Internet, by size class (% of enterprises).png
(
file
)
31 KB
1
16:23, 12 March 2013
Enterprises providing portable devices for mobile connection to the Internet, by type of device, 2012 (% of enterprises).png
(
file
)
15 KB
1
16:28, 12 March 2013
Enterprises providing portable devices for mobile connection to the Internet by purpose and economic activity, EU27, 2012 (% of enterprises providing portable devices).png
(
file
)
20 KB
1
16:31, 12 March 2013
Obstacles preventing or limiting the use of portable devices that allowed a mobile connection to the Internet, EU27, 2012 (% of enterprises).png
(
file
)
19 KB
1
17:06, 4 April 2013
Evolution of ICT usage variables.png
(
file
)
22 KB
1
17:09, 4 April 2013
Ranking of broadband internet-enabled employees.png
(
file
)
4 KB
1
17:11, 4 April 2013
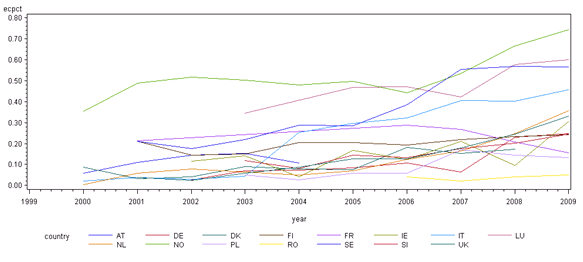
Development of sum of e-sales and e-purchases (ECpct) over years.png
(
file
)
26 KB
1
09:35, 5 April 2013
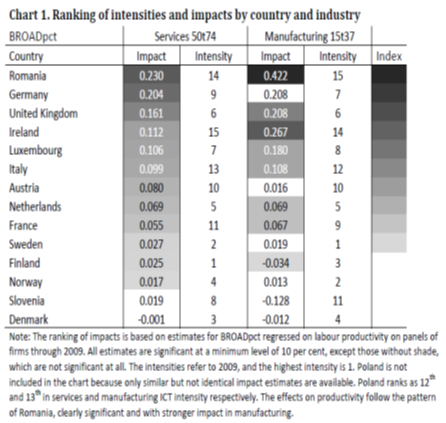
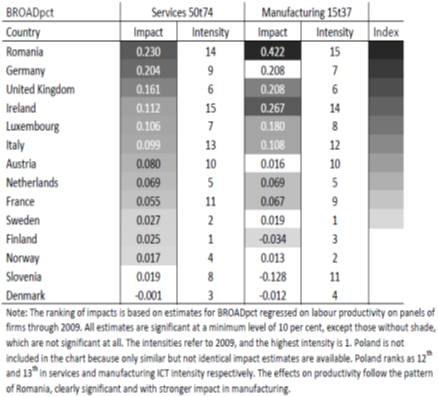
Ranking of intensities and impacts by country and industry.png
(
file
)
111 KB
3
09:47, 5 April 2013
Ranking of intensities and impacts by country and industry .png
(
file
)
101 KB
2
09:52, 5 April 2013
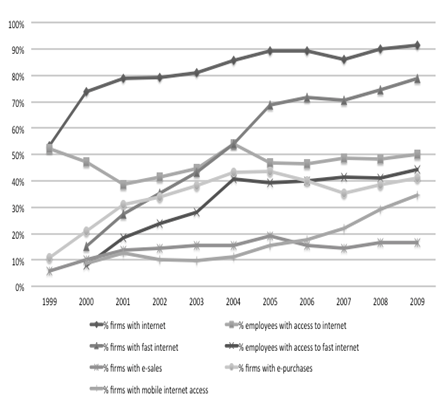
Evolution of ICT usage variables (Total economy averages across countries, per cent).png
(
file
)
45 KB
1
18:01, 2 December 2013
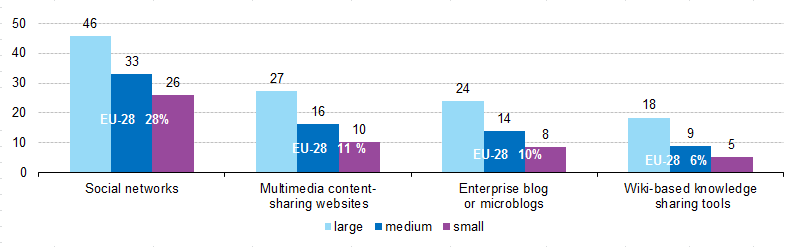
Enterprises using social media, by type of social media and size class, EU-28, 2013 (% of enterprises).png
(
file
)
7 KB
1
18:08, 2 December 2013
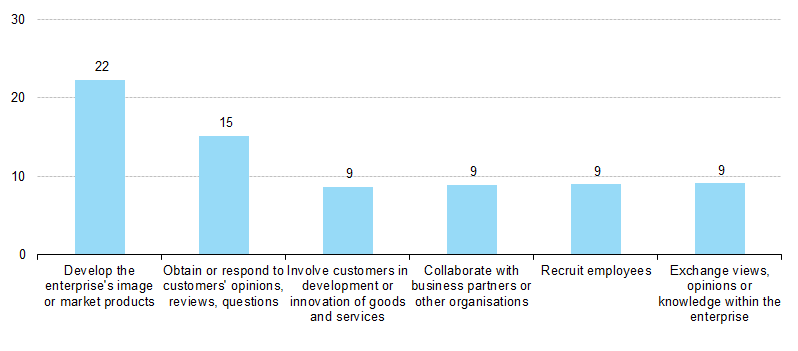
Enterprises using social media, by purpose of use, EU-28, 2013 (% of enterprises).png
(
file
)
8 KB
1
18:10, 2 December 2013
Enterprises using social media, by purpose of use and size class, EU-28, 2013 (% of enterprises using social media).png
(
file
)
13 KB
1
18:10, 2 December 2013
Enterprises using social media, by purpose of use and economic activity, EU-28, 2013 (% of enterprises using social media).png
(
file
)
21 KB
1
18:23, 2 December 2013
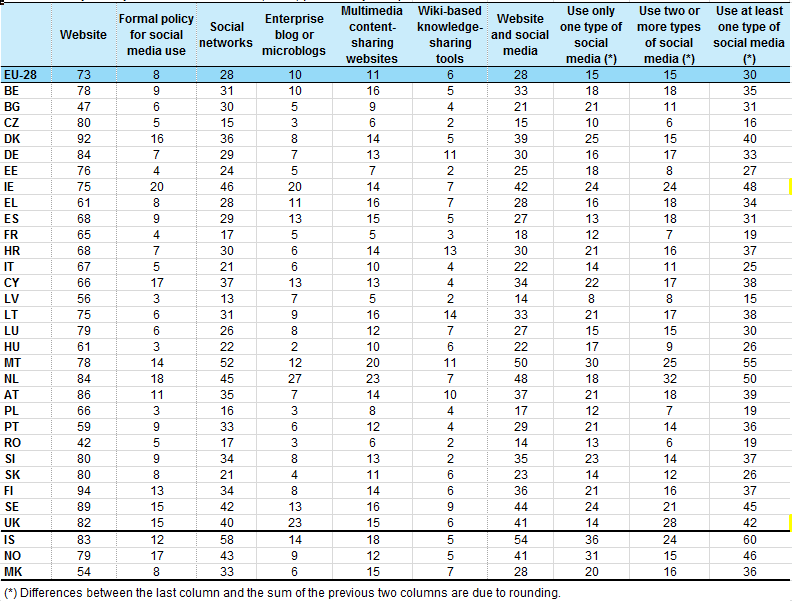
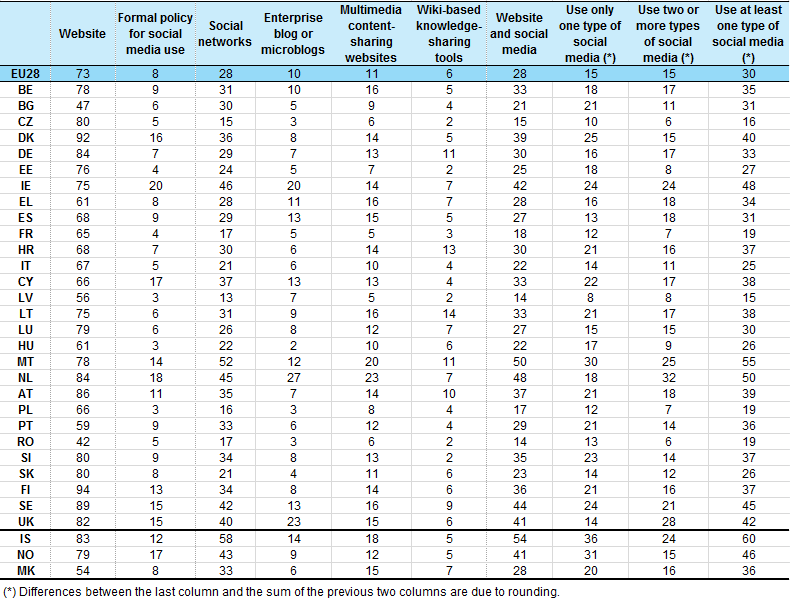
Enterprises' presence on the internet, 2013, (% of enterprises).png
(
file
)
30 KB
2
19:01, 2 December 2013
Enterprises' presence on the internet, 2013, (% of enterprises) v3.png
(
file
)
30 KB
1
13:09, 5 December 2013
Enterprises presence on the internet, 2013, (% of enterprises) v4.png
(
file
)
30 KB
1
14:49, 9 December 2013
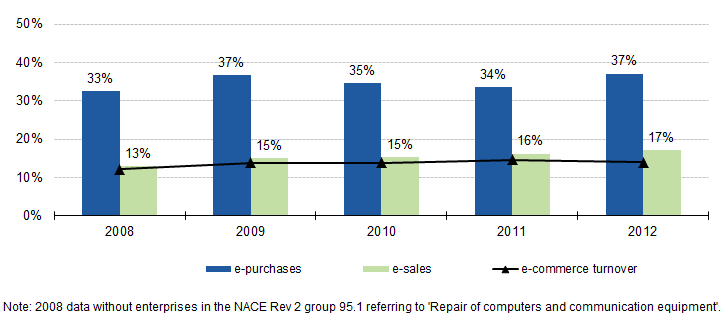
E-commerce sales and purchases, turnover from e-commerce, 2008-2012, EU-28 (% enterprises, % total turnover).png
(
file
)
8 KB
1
14:51, 9 December 2013
E-commerce sales and purchases, turnover from e-commerce, by size class, 2008-2012, EU-28 (% enterprises, % total turnover).png
(
file
)
8 KB
1
14:52, 9 December 2013
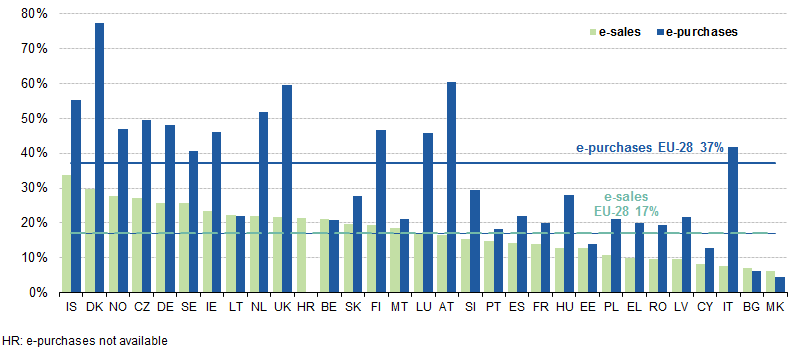
E-commerce sales and purchases, 2012 (% enterprises).png
(
file
)
9 KB
1
14:54, 9 December 2013
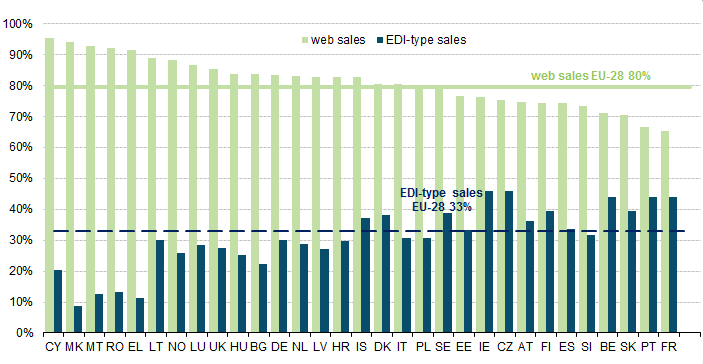
E-commerce sales broken down by web and EDI-type sales, 2012 (% enterprises with e-sales).png
(
file
)
10 KB
1
14:56, 9 December 2013
E-commerce sales broken down by web and EDI-type sales, 2012, (% enterprises with e-sales).png
(
file
)
16 KB
1
15:00, 9 December 2013
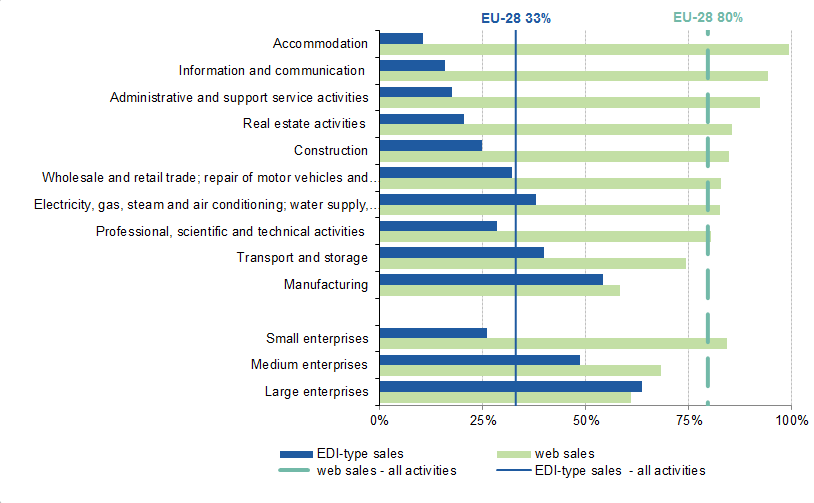
E-commerce sales broken down by web and EDI-type sales and by economic activity, EU-28, 2012, (% enterprises with e-sales).png
(
file
)
16 KB
1
15:01, 9 December 2013
Turnover from e-commerce broken down by web and EDI-type sales, 2012 (% total turnover).png
(
file
)
6 KB
1
First page
Previous page
Next page
Last page
Special page
ISSN 2443-8219
.png)
.png)
.png)
.png)
.png)
.png)
.png)
.png)
v1.png)
.png)
.png)
.png)
.png)
.png)
.png)
.png)
.png)
.png)
.png)
.png)
.png)
.png)
.png)
.png)
.png)


_over_years.png)


.png)
.png)
.png)
.png)
.png)
.png)
_v3.png)
_v4.png)
.png)
.png)
.png)
.png)
.png)
.png)
.png)
.png)
.png)
.png)
.png)