Tutorials
Log in
Statistics Explained
menu
search
search
Navigation
Main page
Statistical themes
Glossary
Categories
Statistics 4 beginners
Tutorials
Help
Eurostat home
Education corner
Online publications
Regional yearbook
Sustainable development
Full list
Tools
User contributions
Logs
View user groups
Special pages
search
Navigation
Main page
Statistical themes
Glossary
Categories
Statistics 4 beginners
Tutorials
Help
Eurostat home
Education corner
Online publications
Regional yearbook
Sustainable development
Full list
Tools
User contributions
Logs
View user groups
Special pages
Navigation
Main page
Statistical themes
Glossary
Categories
Statistics 4 beginners
Tutorials
Help
Eurostat home
Education corner
Online publications
Regional yearbook
Sustainable development
Full list
Tools
User contributions
Logs
View user groups
Special pages
Uploads by Sghirto
This special page shows all uploaded files.
File list
Items per page:
20
50
100
250
500
Search for media name:
Username:
Include old versions of files
Go
First page
Previous page
Next page
Last page
Date
Name
Thumbnail
Size
Description
Versions
16:42, 15 February 2013
MW EUR January 2013.png
(
file
)
13 KB
1
16:43, 15 February 2013
MW PPS January 2013.png
(
file
)
10 KB
1
16:44, 15 February 2013
MW as % of mean January 2013.png
(
file
)
8 KB
1
16:10, 18 February 2013
MW map EUR January 2013.png
(
file
)
156 KB
1
11:24, 23 July 2013
MW EUR July 2013.png
(
file
)
13 KB
1
11:26, 23 July 2013
MW PPS July 2013.png
(
file
)
9 KB
1
12:28, 25 July 2013
MW PPS July 2013 2.png
(
file
)
10 KB
1
09:59, 26 July 2013
MW EUR July 2013 2.png
(
file
)
4 KB
3
10:03, 26 July 2013
MW EUR July 2013 3.png
(
file
)
4 KB
1
10:06, 26 July 2013
Wages and labour costs update July2013.xls
(
file
)
527 KB
3
11:40, 12 September 2013
MW as % of mean July 2013v2.png
(
file
)
8 KB
1
12:30, 12 September 2013
MW map EUR July 2013.png
(
file
)
75 KB
4
10:41, 10 October 2013
MW as % of mean July 2013.png
(
file
)
8 KB
2
10:49, 10 October 2013
MW as % of mean July 2013v3.png
(
file
)
8 KB
1
10:44, 19 April 2016
Figure5 Annual net earnings 2015.png
(
file
)
41 KB
1
10:45, 19 April 2016
Table1 TaxRateIndicators.png
(
file
)
38 KB
1
11:42, 24 June 2021
Tab1-Income components of GDP (%) in 2020 and 2000.png
(
file
)
114 KB
1
11:44, 24 June 2021
Fig2-Changes to comp of empl 2000-2020.png
(
file
)
76 KB
1
11:46, 24 June 2021
Fig3-Changes to wages and salaries as a percentage of GDP between 2000 and 2020.png
(
file
)
41 KB
1
11:47, 24 June 2021
Fig4-Changes to empl social contrib 2000-2020.png
(
file
)
80 KB
1
11:48, 24 June 2021
Fig5-Changes to tax on prod and import 2000-2020.png
(
file
)
46 KB
1
11:48, 24 June 2021
Fig6-Changes to operating surplus and mixed income, gross as a percentage of GDP between 2000 and 2020.png
(
file
)
42 KB
1
11:49, 24 June 2021
Fig7-Evolution of the main income components (% of GDP, 2000-2020).png
(
file
)
42 KB
1
12:36, 24 June 2021
Fig1-Shares of income components to GDP in 2019.png
(
file
)
86 KB
2
13:19, 24 June 2021
Fig1- Shares of income components to GDP in 2020.png
(
file
)
86 KB
1
15:03, 24 June 2021
Fig3-Changes to comp of empl 2000-2020.png
(
file
)
76 KB
1
15:08, 24 June 2021
Fig4-Changes to wages and salaries as a percentage of GDP between 2000 and 2020.png
(
file
)
41 KB
1
15:10, 24 June 2021
Fig6-Changes to tax on prod and import 2000-2020.png
(
file
)
46 KB
1
15:11, 24 June 2021
Fig7-Changes to operating surplus and mixed income, gross as a percentage of GDP between 2000 and 2020.png
(
file
)
42 KB
1
19:35, 16 July 2021
GDP and employment growth rates, % change over the previous quarter, based on seasonally adjusted data, 2020Q4.png
(
file
)
126 KB
3
20:03, 16 July 2021
Decomposition of GDP growth by expenditure aggregates,contributions to growth (over the previous quarter) in percentage points, 2021Q1.png
(
file
)
289 KB
1
20:07, 16 July 2021
Growth rates of employment in persons (¹), 2020Q4.png
(
file
)
886 KB
4
20:08, 16 July 2021
Growth rates of employment in hours worked (¹), 2021Q1.png
(
file
)
914 KB
1
20:11, 16 July 2021
Employment growth rates % change over the previous quarter, based on seasonally adjusted data, 2021Q1.png
(
file
)
126 KB
1
14:04, 15 October 2021
Growth rates of GDP in volume (based on seasonally adjusted data), 2021Q1.png
(
file
)
888 KB
2
14:14, 15 October 2021
GDP growth rates, % change over the previous quarter, based on seasonally adjusted data, 2021Q2.png
(
file
)
128 KB
1
14:16, 15 October 2021
Decomposition of GDP growth by expenditure aggregates,contributions to growth (over the previous quarter) in percentage points, 2021Q2.png
(
file
)
251 KB
1
14:41, 15 October 2021
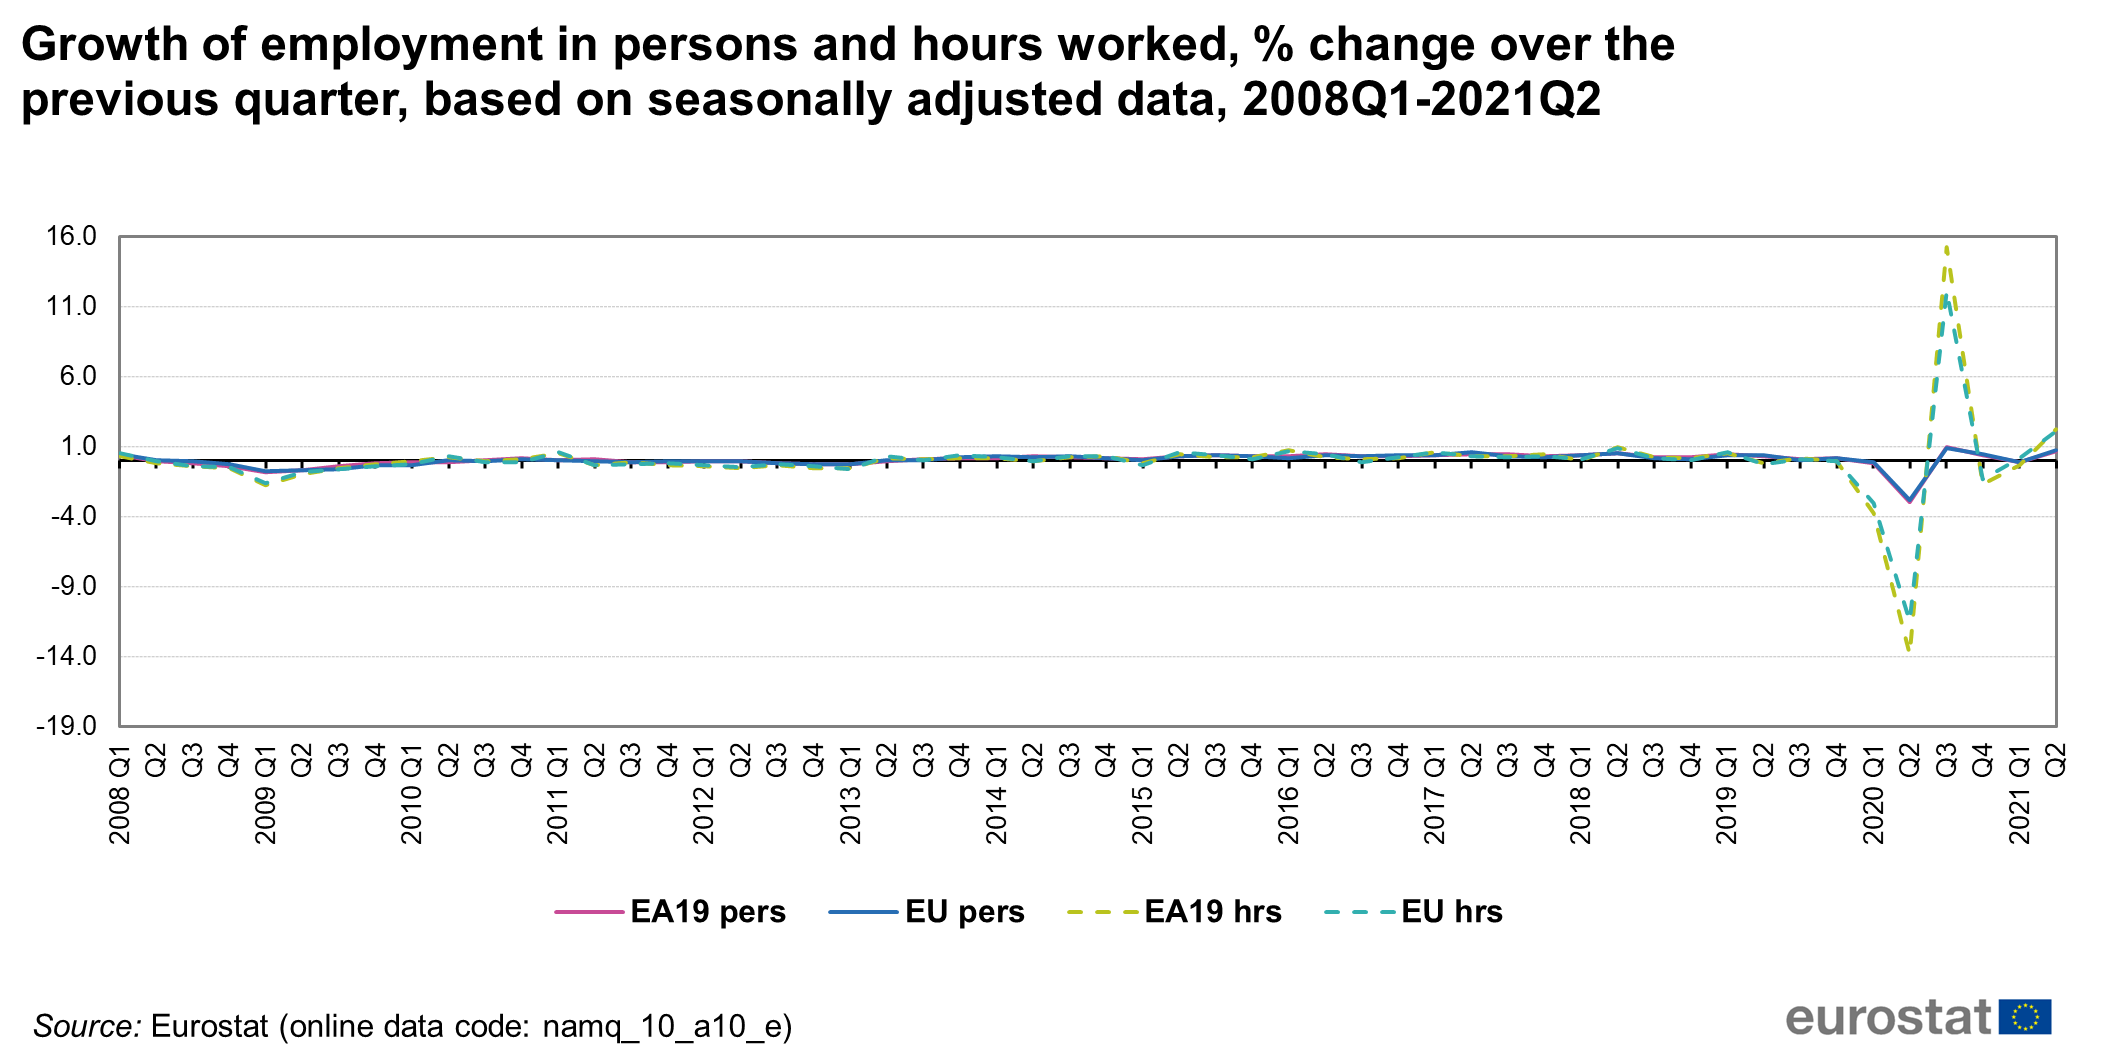
Growth of employment in persons and hours worked, % change over the previous quarter, based on seasonally adjusted data, 2021Q2.png
(
file
)
131 KB
1
14:59, 15 October 2021
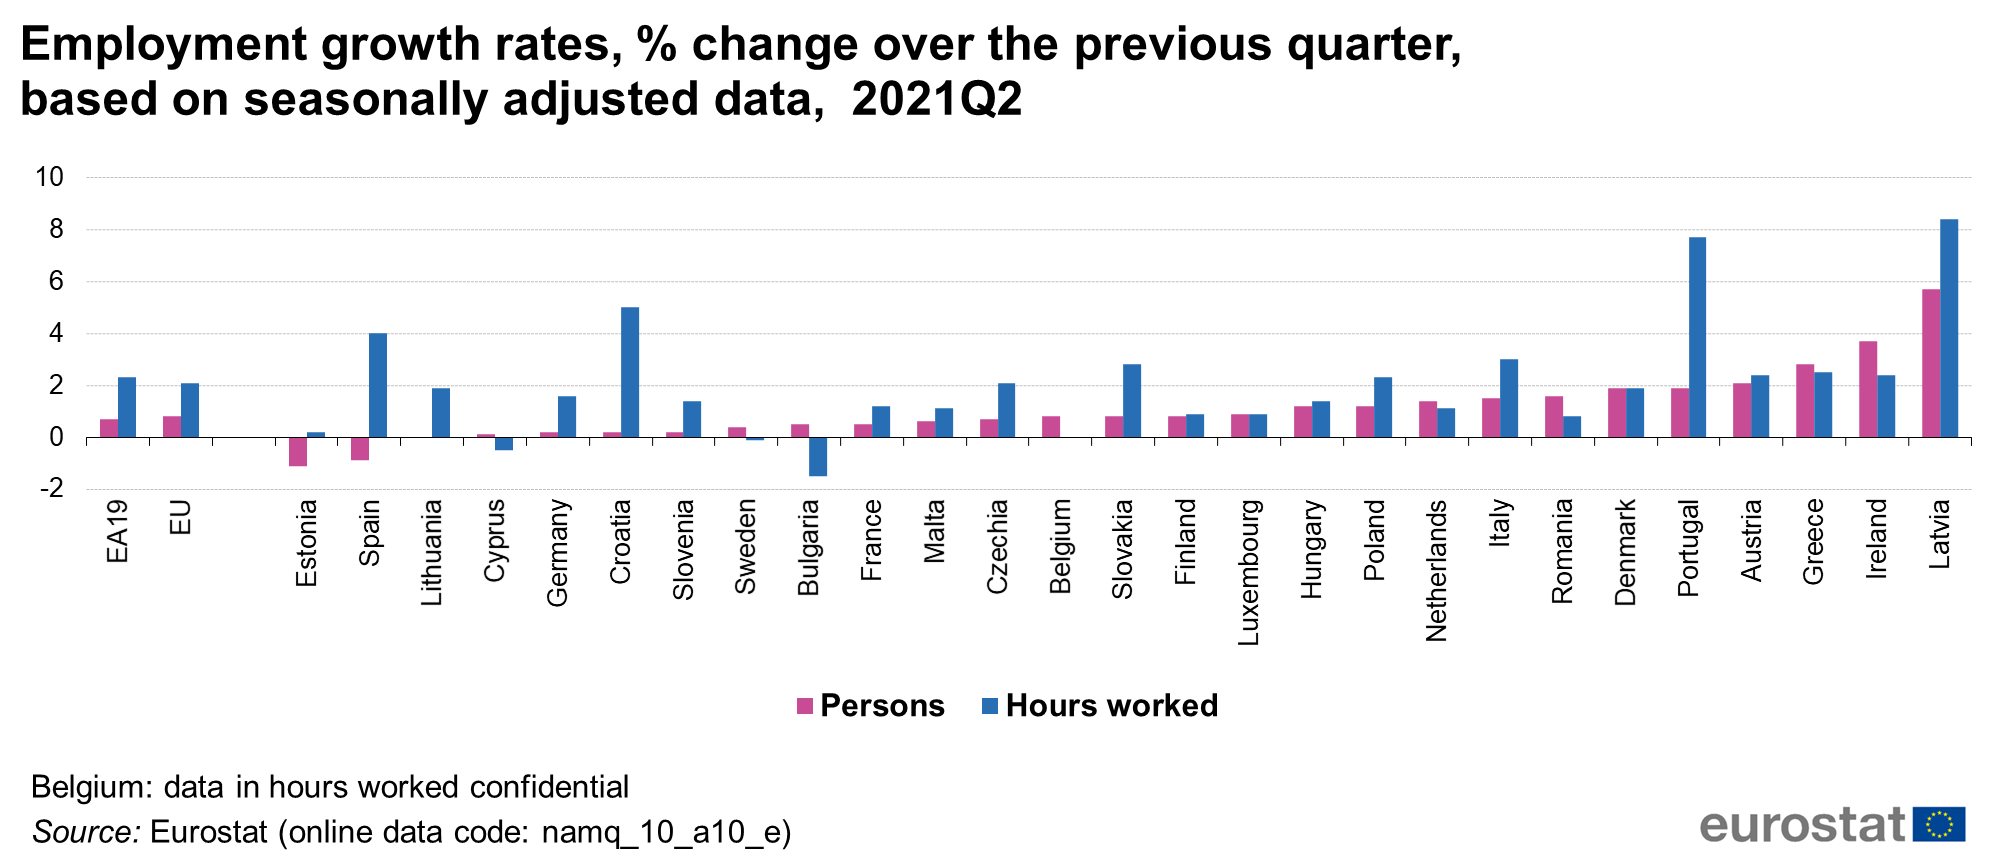
Employment growth rates % change over the previous quarter, based on seasonally adjusted data, 2021Q2.png
(
file
)
128 KB
2
15:17, 15 October 2021
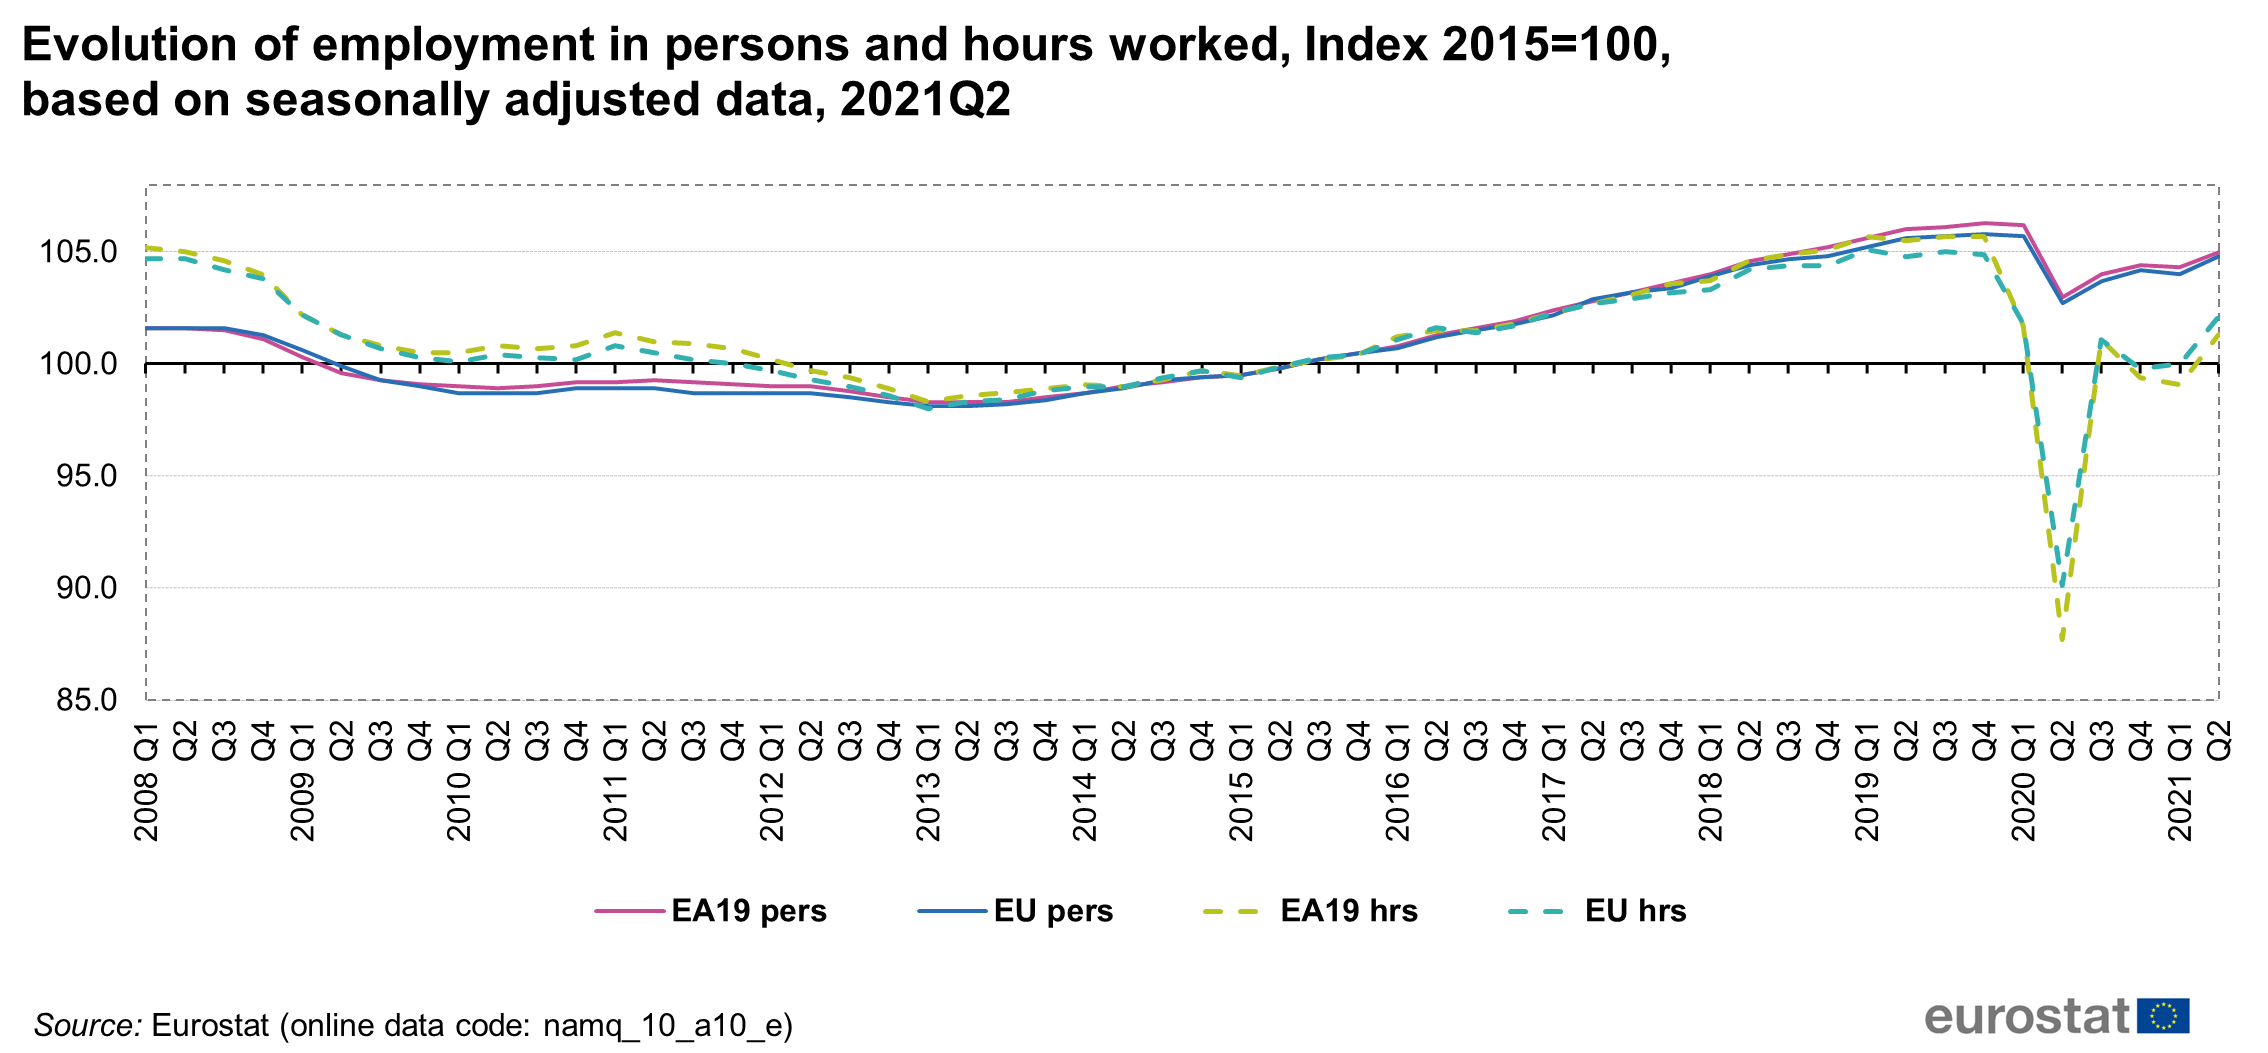
Evolution of employment in persons and hours worked, index 2015=100, based on seasonally adjusted data, 2021Q02.png
(
file
)
170 KB
1
15:18, 15 October 2021
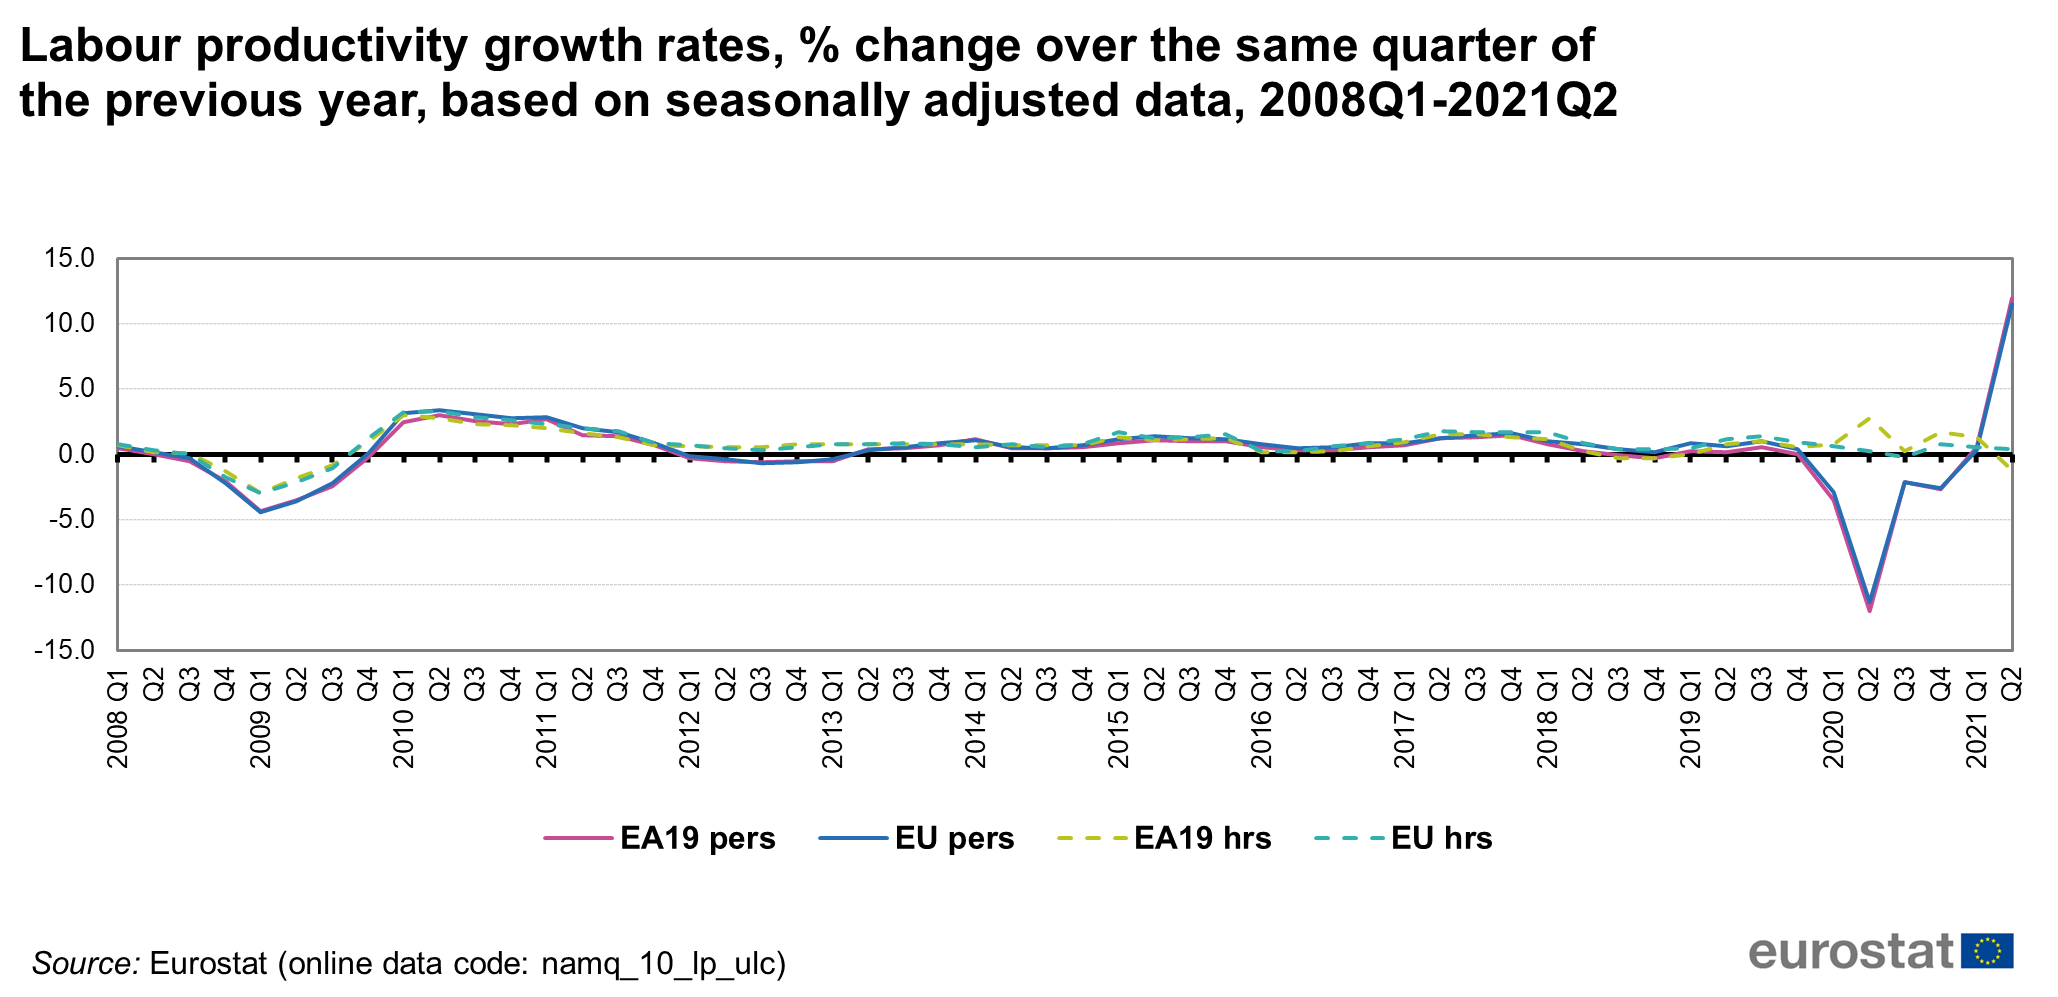
Labour productivity growth rates, % change over the same quarter of the previous year, based on seasonally adjusted data, 2021Q02.png
(
file
)
132 KB
1
15:39, 17 January 2022
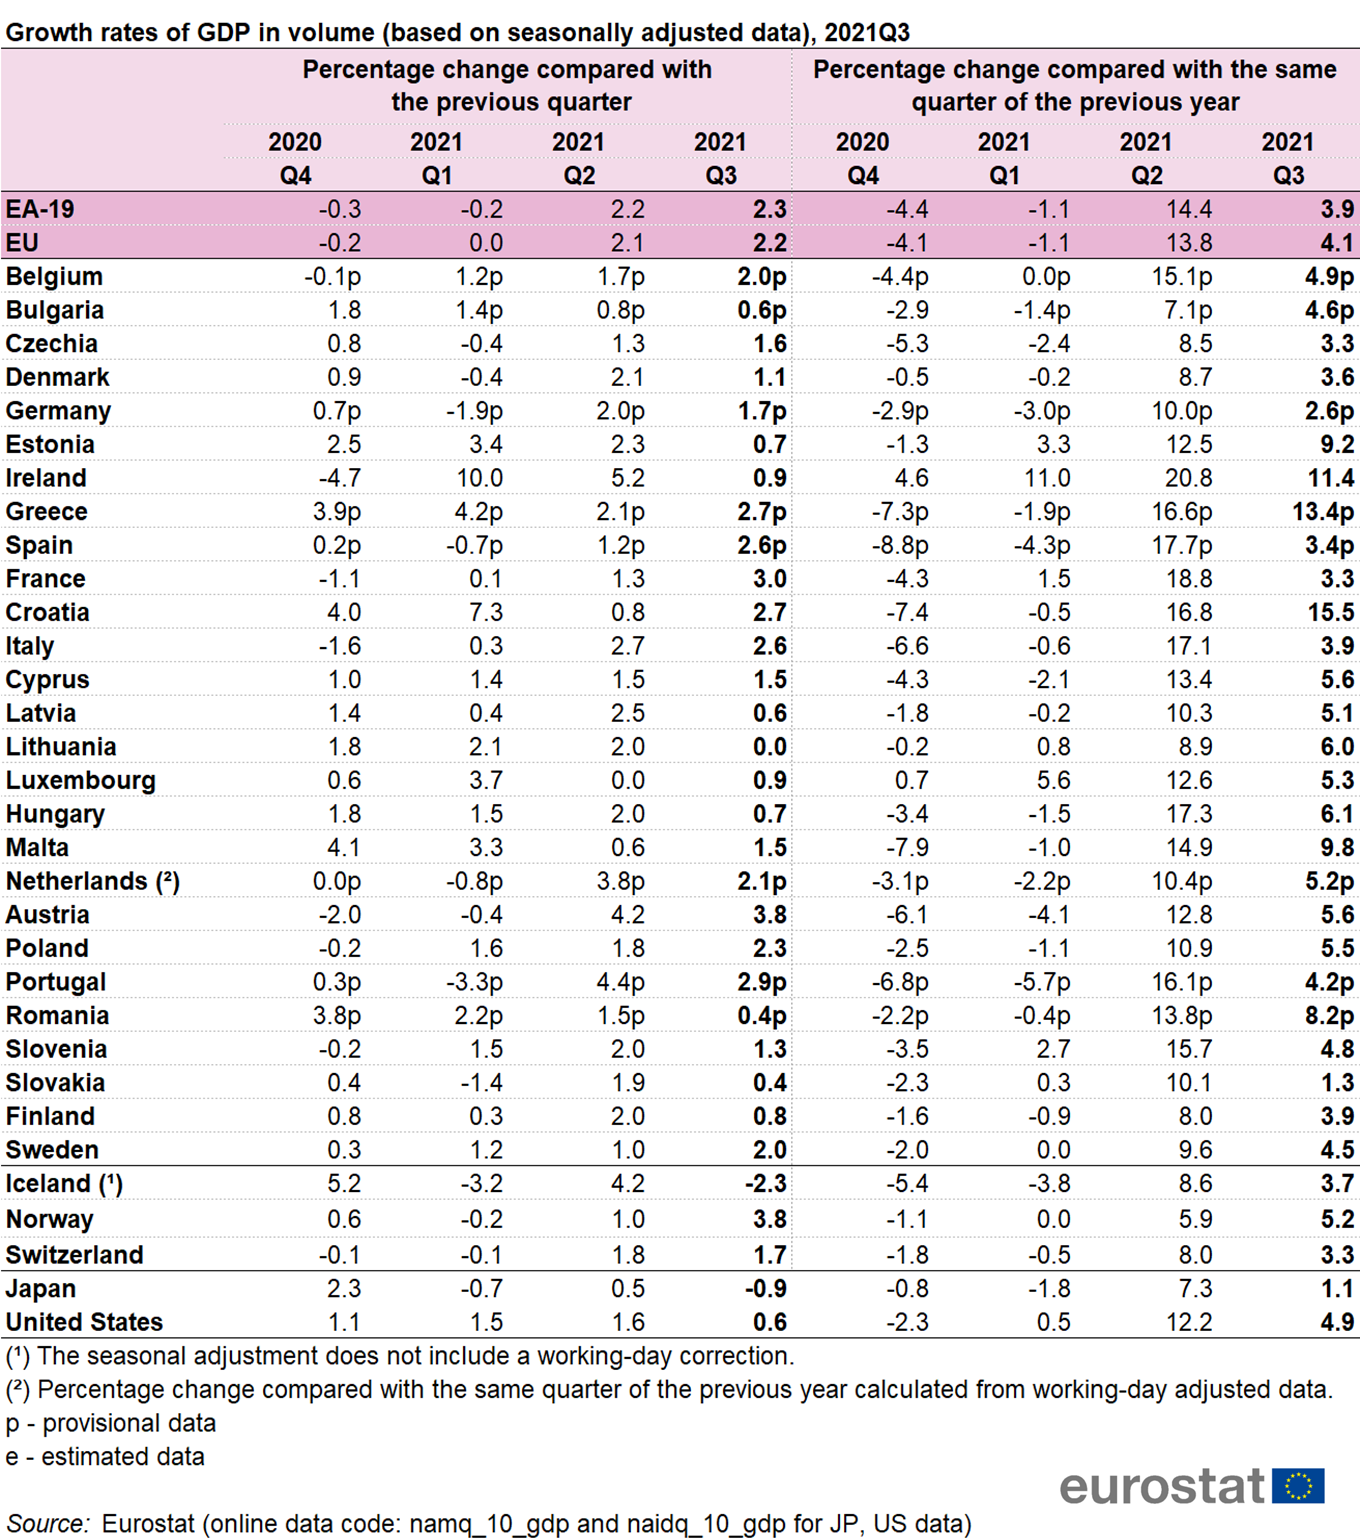
Growth rates of GDP in volume (based on seasonally adjusted data), 2021Q2.png
(
file
)
819 KB
3
16:01, 17 January 2022
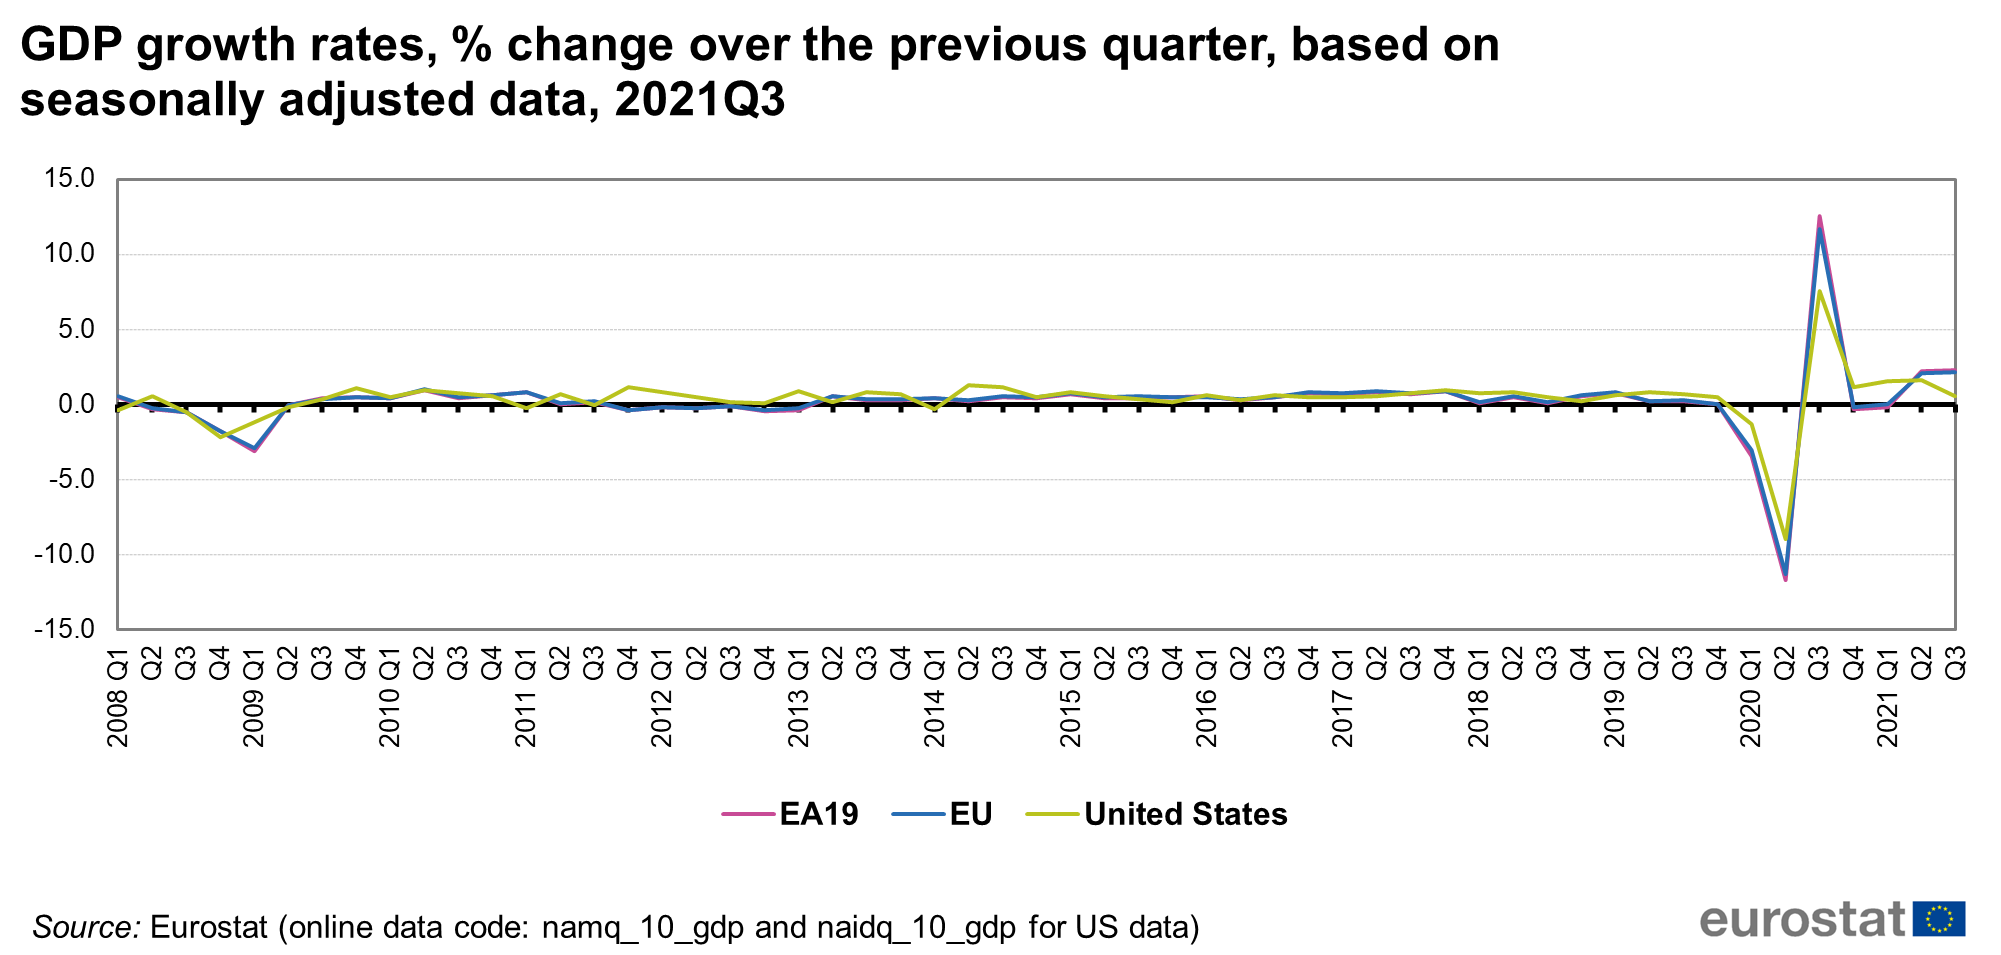
GDP growth rates, % change over the previous quarter, based on seasonally adjusted data, 2021Q3.png
(
file
)
123 KB
1
16:03, 17 January 2022
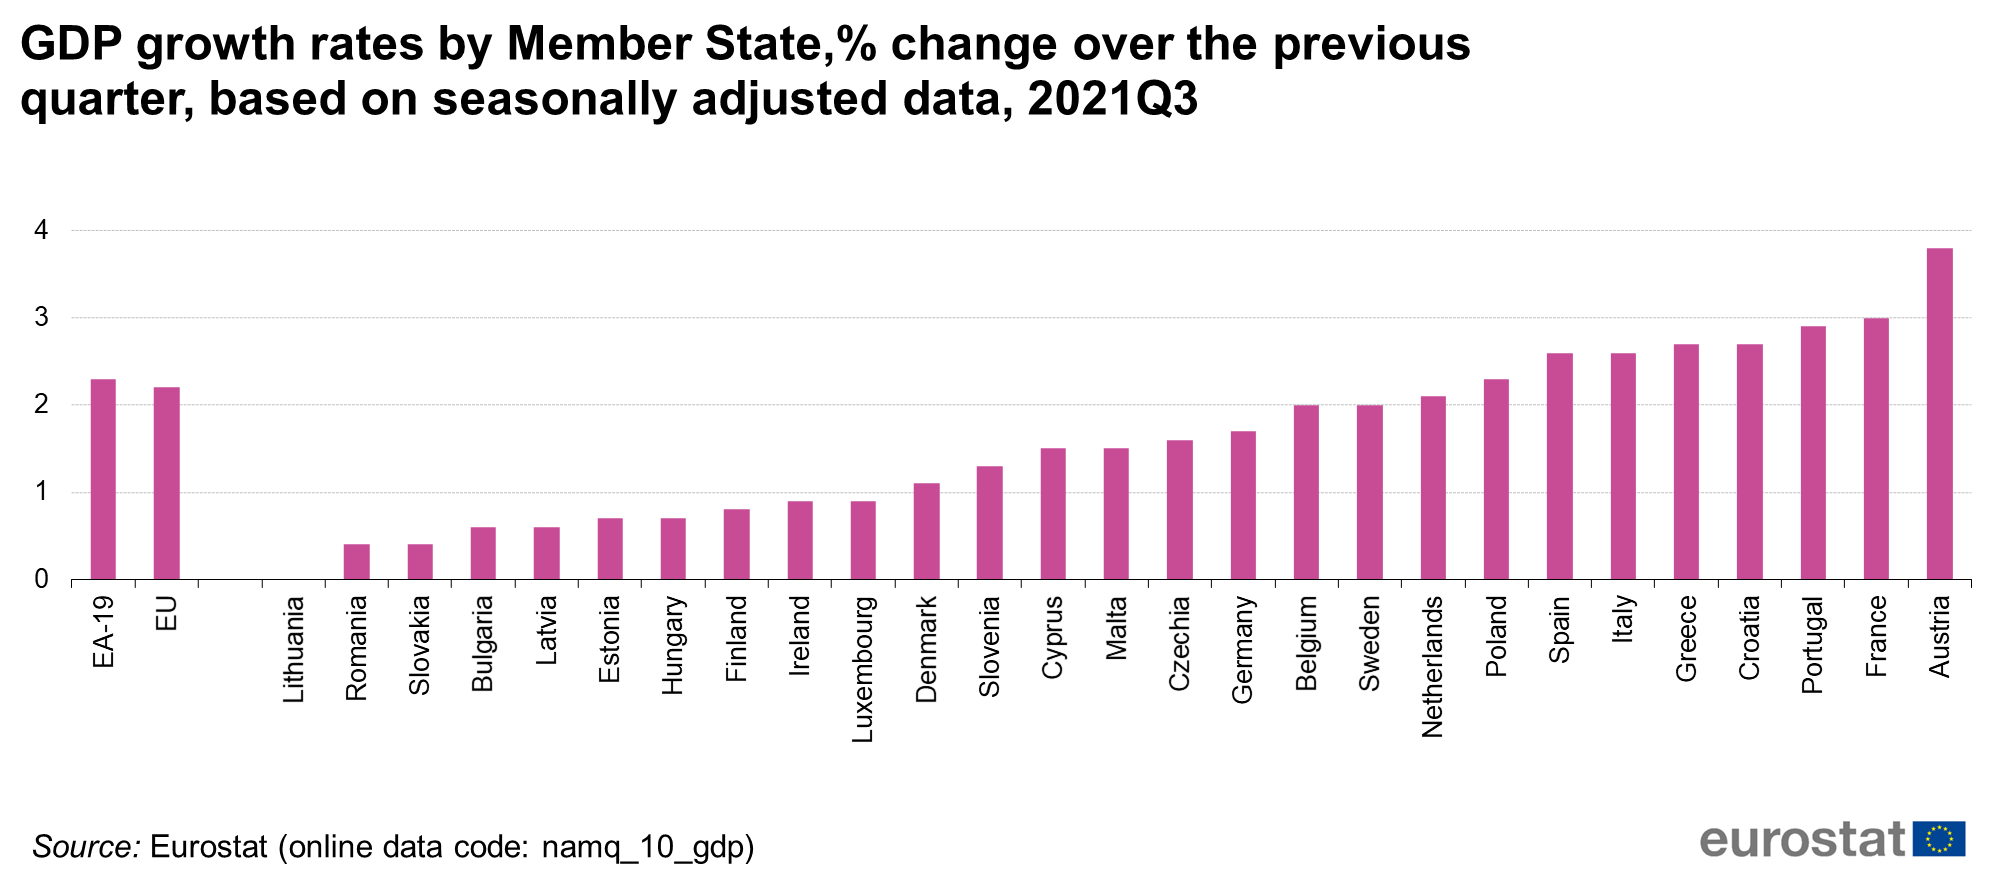
GDP growth rates by Member State, % change over the previous quarter, based on seasonally adjusted data, 2021Q3.png
(
file
)
123 KB
1
16:03, 18 March 2022
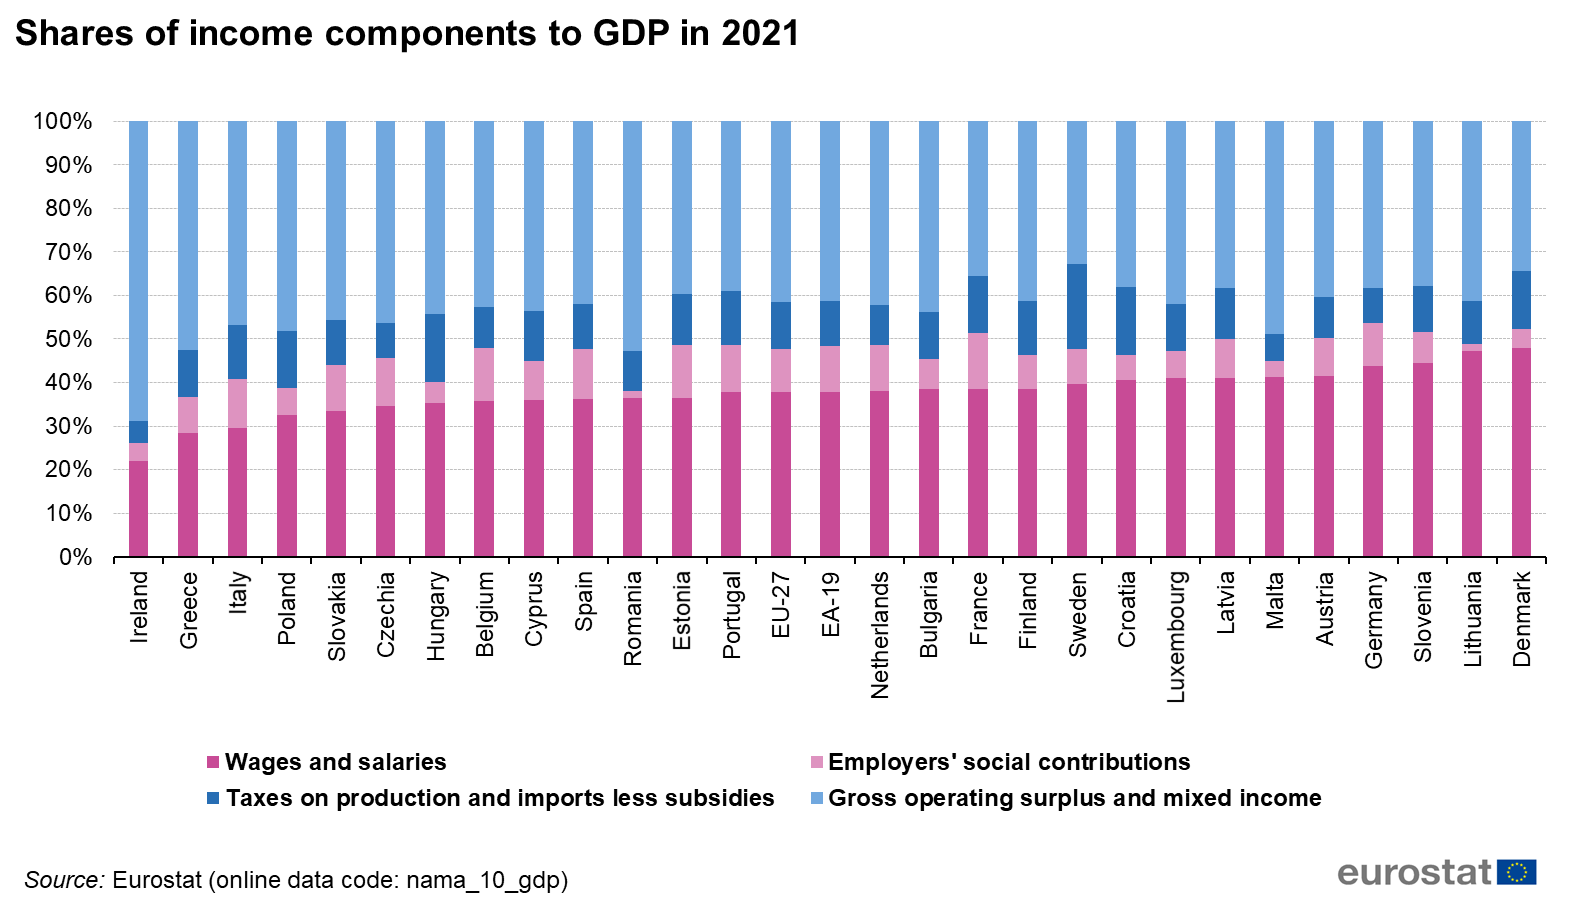
Fig1- Shares of income components to GDP in 2021.png
(
file
)
152 KB
1
17:03, 18 March 2022
Fig2-Evolution of the main income components (% of GDP, 2001-2021).png
(
file
)
72 KB
1
11:26, 21 March 2022
Fig3-Changes to comp of empl 2001-2021.png
(
file
)
75 KB
1
11:27, 21 March 2022
Fig4-Changes to wages and salaries as a percentage of GDP between 2001 and 2021.png
(
file
)
74 KB
1
11:28, 21 March 2022
Fig5-Changes to empl social contrib 2001-2021.png
(
file
)
79 KB
1
11:28, 21 March 2022
Fig6-Changes to tax on prod and import 2001-2021.png
(
file
)
82 KB
1
First page
Previous page
Next page
Last page
Special page
ISSN 2443-8219


_in_2020_and_2000.png)


.png)


_in_percentage_points,_2021Q1.png)
,_2020Q4.png)
,_2021Q1.png)

,_2021Q1.png)

_in_percentage_points,_2021Q2.png)


,_2021Q2.png)


.png)


