Tutorials
Log in
Statistics Explained
menu
search
search
Navigation
Main page
Statistical themes
Glossary
Categories
Statistics 4 beginners
Tutorials
Help
Eurostat home
Education corner
Online publications
Regional yearbook
Sustainable development
Full list
Tools
User contributions
Logs
View user groups
Special pages
search
Navigation
Main page
Statistical themes
Glossary
Categories
Statistics 4 beginners
Tutorials
Help
Eurostat home
Education corner
Online publications
Regional yearbook
Sustainable development
Full list
Tools
User contributions
Logs
View user groups
Special pages
Navigation
Main page
Statistical themes
Glossary
Categories
Statistics 4 beginners
Tutorials
Help
Eurostat home
Education corner
Online publications
Regional yearbook
Sustainable development
Full list
Tools
User contributions
Logs
View user groups
Special pages
Uploads by SCipponeri
This special page shows all uploaded files.
File list
Items per page:
20
50
100
250
500
Search for media name:
Username:
Include old versions of files
Go
First page
Previous page
Next page
Last page
Date
Name
Thumbnail
Size
Description
Versions
11:42, 19 December 2011
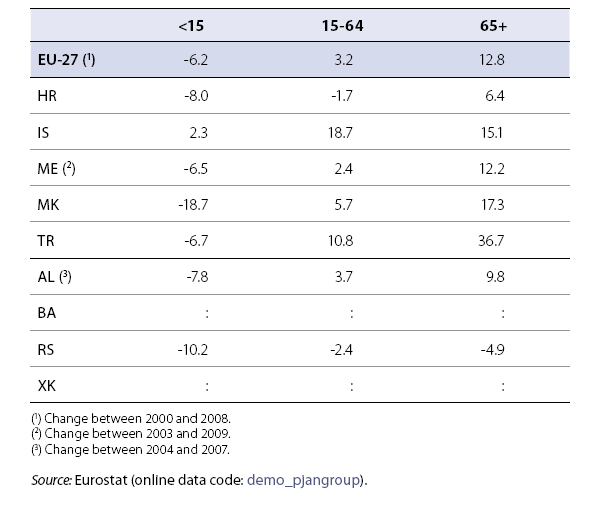
Change in the population by age class between 2000.png
(
file
)
21 KB
1
13:07, 19 December 2011
Total fertility rate (mean number of children per women).PNG
(
file
)
20 KB
1
13:20, 19 December 2011
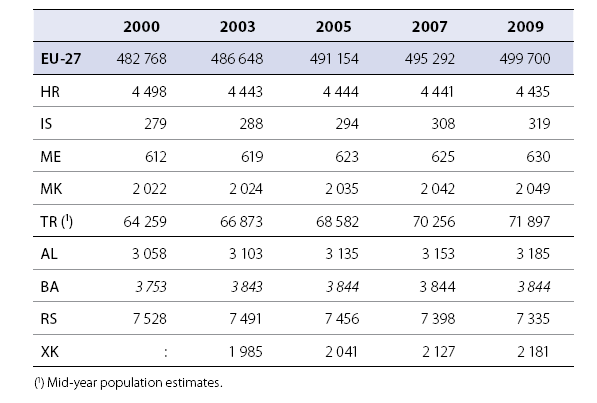
Population as of 1st January (1000).PNG
(
file
)
21 KB
2
13:21, 19 December 2011
Population by age class, 2009 (% of total population).PNG
(
file
)
20 KB
2
13:21, 19 December 2011
Crude birth and death rates (per 1 000 inhabitants).PNG
(
file
)
25 KB
2
13:22, 19 December 2011
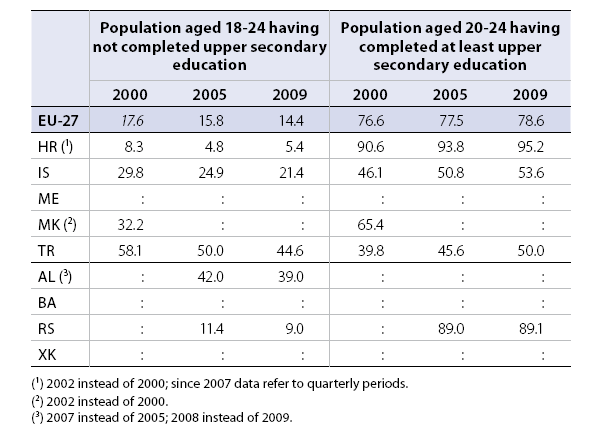
Upper secondary education.PNG
(
file
)
28 KB
1
13:22, 19 December 2011
Number of pupils by ISCED level of education.PNG
(
file
)
18 KB
1
13:22, 19 December 2011
Number of pupils by ISCED level of education 4-6.PNG
(
file
)
27 KB
1
13:34, 19 December 2011
Number of students in tertiery education (ISCED 5 and ISCED 6).PNG
(
file
)
25 KB
2
20:52, 19 December 2011
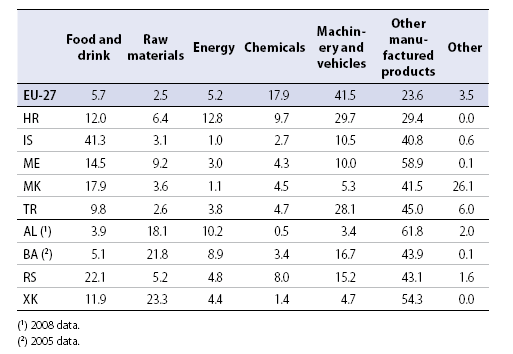
Breakdown of export of goods, 2009.png
(
file
)
14 KB
1
20:52, 19 December 2011
Breakdown of imports of goods, 2009.png
(
file
)
14 KB
1
20:53, 19 December 2011
International trade in goods.png
(
file
)
13 KB
1
20:54, 19 December 2011
International trade in goods, average annaul growth rates.png
(
file
)
6 KB
1
20:54, 19 December 2011
International trade in goods, average annual growth rates 2000-2009.png
(
file
)
9 KB
1
20:54, 19 December 2011
International trade in goods, total.png
(
file
)
16 KB
1
20:55, 19 December 2011
International trade in goods with EU-27, 2009.png
(
file
)
6 KB
2
23:46, 19 December 2011
GDP growth rate at constant prices (1).png
(
file
)
12 KB
1
23:48, 19 December 2011
General government debt relative to GDP (5).png
(
file
)
10 KB
1
23:49, 19 December 2011
Annual average inflation rates (6).png
(
file
)
14 KB
1
23:49, 19 December 2011
Foreign direct investment (million EUR) (7).png
(
file
)
14 KB
1
23:50, 19 December 2011
Gross value added at basic prices, (3).png
(
file
)
10 KB
1
00:09, 20 December 2011
GDP per capita in Purchasing Power Standards (2).png
(
file
)
12 KB
2
00:29, 20 December 2011
General government deficit surplus (4).png
(
file
)
11 KB
1
13:12, 7 February 2012
GDP per capita in Purchasing Power Standards (PPS).PNG
(
file
)
26 KB
1
13:18, 7 February 2012
GDP per capita in Purchasing Power Standards (PPS) (2).png
(
file
)
26 KB
1
12:35, 26 March 2013
Figure 1 Total criminality 2007 2010.PNG
(
file
)
22 KB
1
13:10, 26 March 2013
Figure 2.PNG
(
file
)
8 KB
1
13:28, 26 March 2013
Figure 3 Homicide rate 2005 2010.PNG
(
file
)
25 KB
1
13:33, 26 March 2013
Figure 4 Prison population rate 2005 2010.PNG
(
file
)
27 KB
1
13:34, 26 March 2013
Figure 2 Total recorded crime 2005 2010.PNG.PNG
(
file
)
8 KB
1
13:54, 26 March 2013
Figure 2 Total recorded crime 2005 2010.PNG
(
file
)
8 KB
1
15:43, 26 March 2013
Table1 crimes recorded 2004 2010.PNG
(
file
)
48 KB
1
15:50, 26 March 2013
Table2 violent crime 2004 2010.PNG
(
file
)
42 KB
1
16:03, 26 March 2013
Table3 homicide 2004 2010.PNG
(
file
)
37 KB
1
16:17, 26 March 2013
Table4 robbery 2004 2010.PNG
(
file
)
43 KB
1
16:17, 26 March 2013
Table5 domestic burglary 2004 2010.PNG
(
file
)
43 KB
1
16:17, 26 March 2013
Table6 theft of a motor vehicle 2004 2010.PNG
(
file
)
44 KB
1
16:17, 26 March 2013
Table7 drug trafficking 2004 2010.PNG
(
file
)
48 KB
1
16:17, 26 March 2013
Table8 police officers 2004 2010.PNG
(
file
)
48 KB
1
16:17, 26 March 2013
Table9 prison polpulation 2004 2010.PNG
(
file
)
48 KB
1
16:19, 26 March 2013
Table9 prison population 2004 2010.PNG
(
file
)
48 KB
1
16:40, 27 March 2013
20121214153243!Crime statistics YB2013.xls
(
file
)
1.15 MB
1
16:43, 27 March 2013
Capture 1.PNG
(
file
)
63 KB
1
16:57, 27 March 2013
Police officers 2000 2010.PNG
(
file
)
65 KB
2
17:13, 27 March 2013
Police officers 2000 2010.png
(
file
)
65 KB
1
10:26, 2 April 2013
Crime Police 2000 2010.PNG
(
file
)
65 KB
1
10:32, 2 April 2013
Offences Recorded police 2005 2010.PNG
(
file
)
18 KB
1
10:35, 2 April 2013
Homicides 2007 2010.PNG
(
file
)
18 KB
1
10:38, 2 April 2013
Prison population 2005 2010.PNG
(
file
)
64 KB
1
08:16, 3 April 2013
Police Officers new 2000 2010.PNG
(
file
)
67 KB
1
First page
Previous page
Next page
Last page
Special page
ISSN 2443-8219

.PNG)
.PNG)
.PNG)
.PNG)


.PNG)


.png)
.png)
.png)
_(7).png)
.png)
.png)
.png)
.PNG)
_(2).png)


