Tutorials
Log in
Statistics Explained
menu
search
search
Navigation
Main page
Statistical themes
Glossary
Categories
Statistics 4 beginners
Tutorials
Help
Eurostat home
Education corner
Online publications
Regional yearbook
Sustainable development
Full list
Tools
User contributions
Logs
View user groups
Special pages
search
Navigation
Main page
Statistical themes
Glossary
Categories
Statistics 4 beginners
Tutorials
Help
Eurostat home
Education corner
Online publications
Regional yearbook
Sustainable development
Full list
Tools
User contributions
Logs
View user groups
Special pages
Navigation
Main page
Statistical themes
Glossary
Categories
Statistics 4 beginners
Tutorials
Help
Eurostat home
Education corner
Online publications
Regional yearbook
Sustainable development
Full list
Tools
User contributions
Logs
View user groups
Special pages
Uploads by Ruscova
This special page shows all uploaded files.
File list
Items per page:
20
50
100
250
500
Search for media name:
Username:
Include old versions of files
Go
Date
Name
Thumbnail
Size
Description
Versions
15:51, 11 October 2013
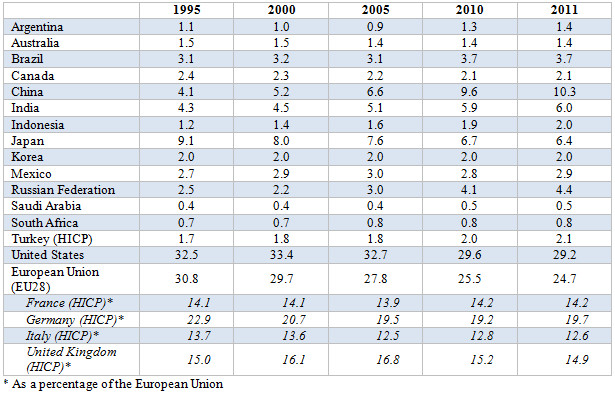
G20 economies weights (in percentage of the G20).PNG
(
file
)
109 KB
1
15:58, 11 October 2013
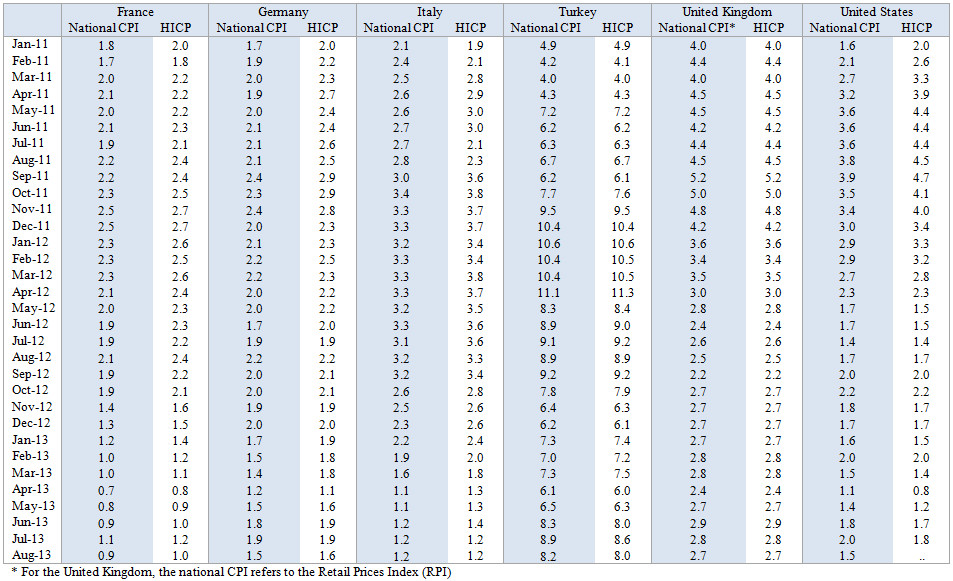
HICP All items vs. National CPI All items.PNG
(
file
)
244 KB
1
16:10, 11 October 2013
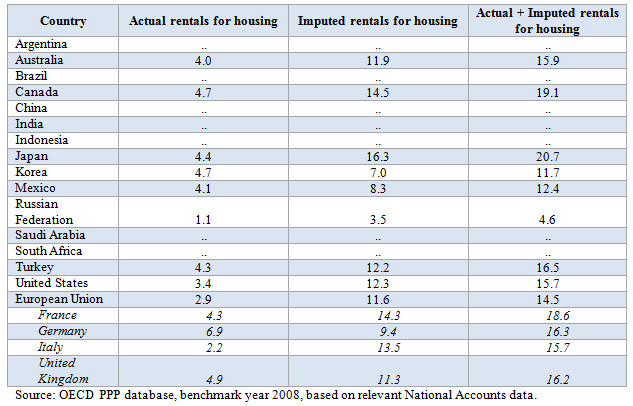
Weights of housing in the individual household consumption in 2008.PNG
(
file
)
85 KB
1
17:00, 11 October 2013
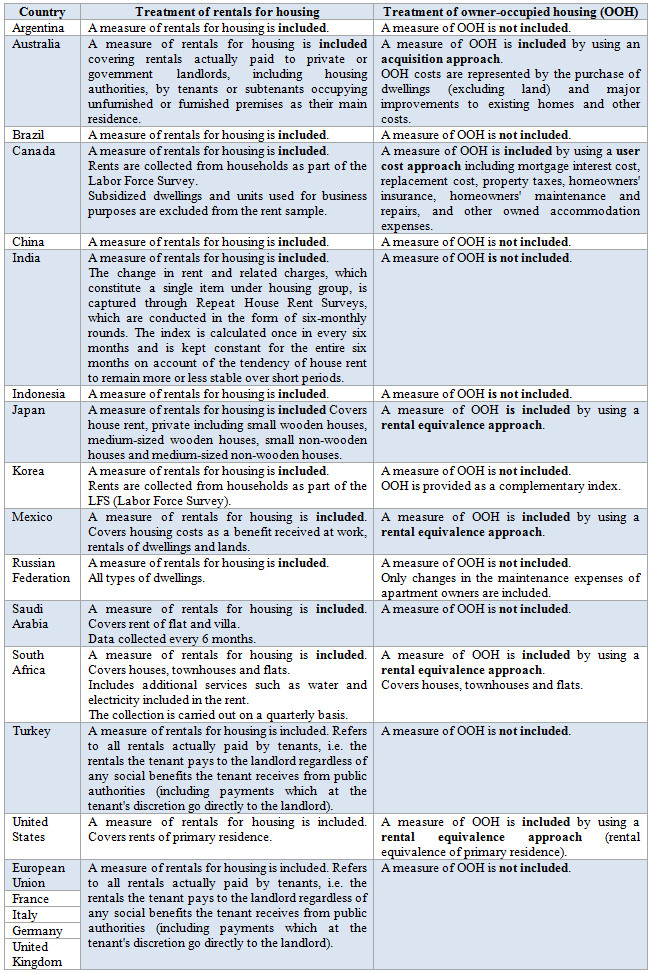
Treatment of housing in the CPI.PNG
(
file
)
440 KB
1
17:04, 11 October 2013
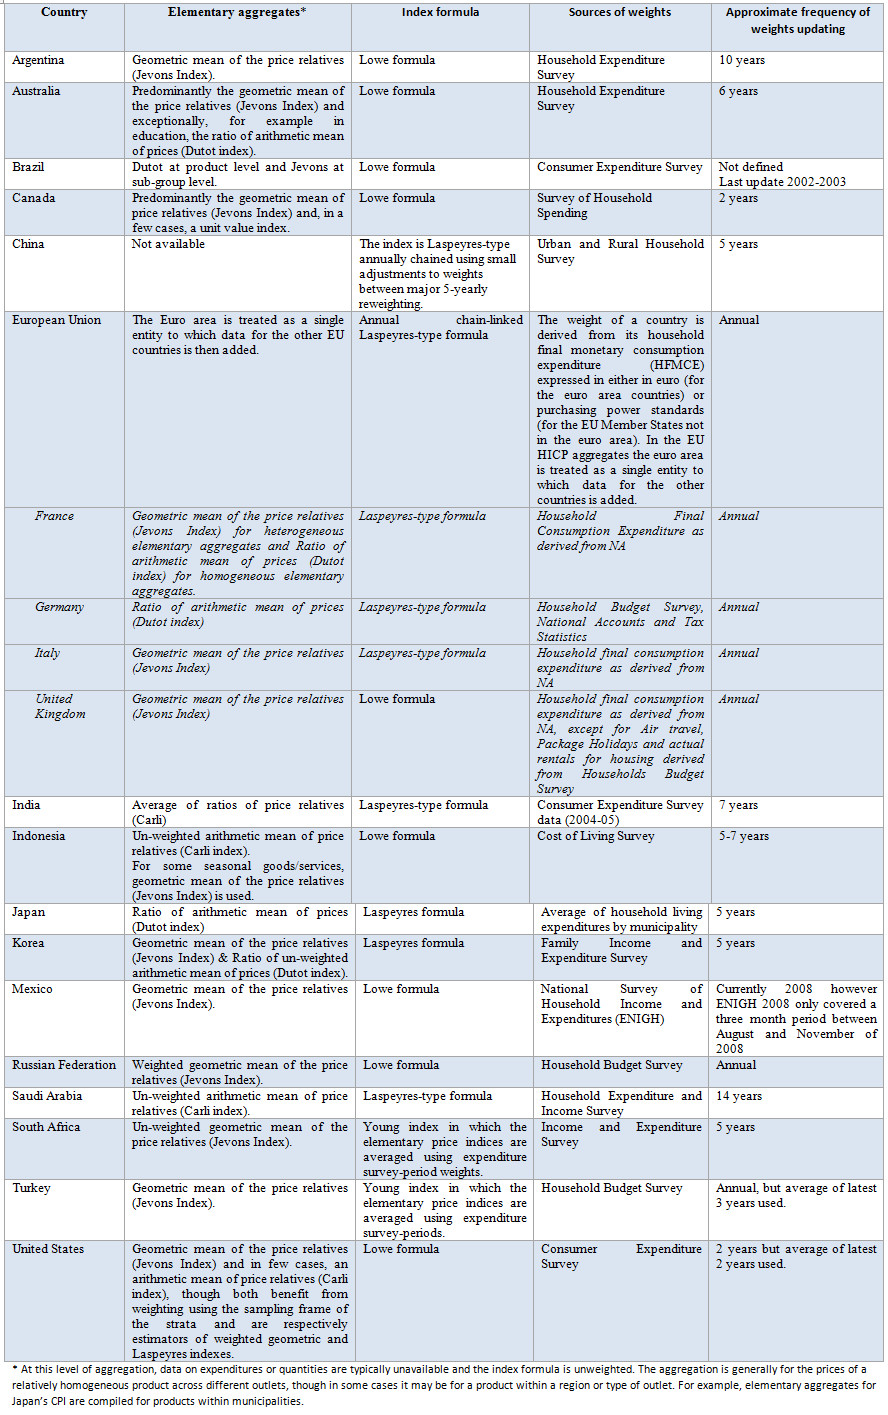
Methods used for index calculation both for elementary aggregates and higher level aggregation.PNG
(
file
)
557 KB
1
12:36, 14 October 2013
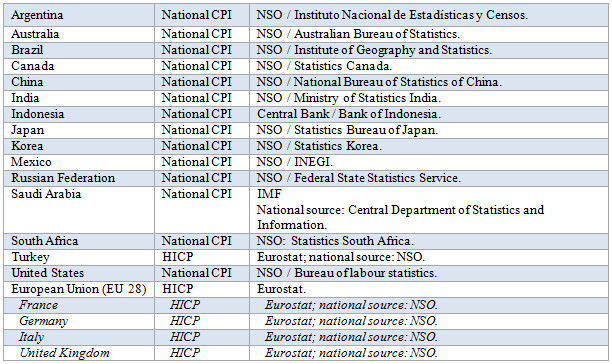
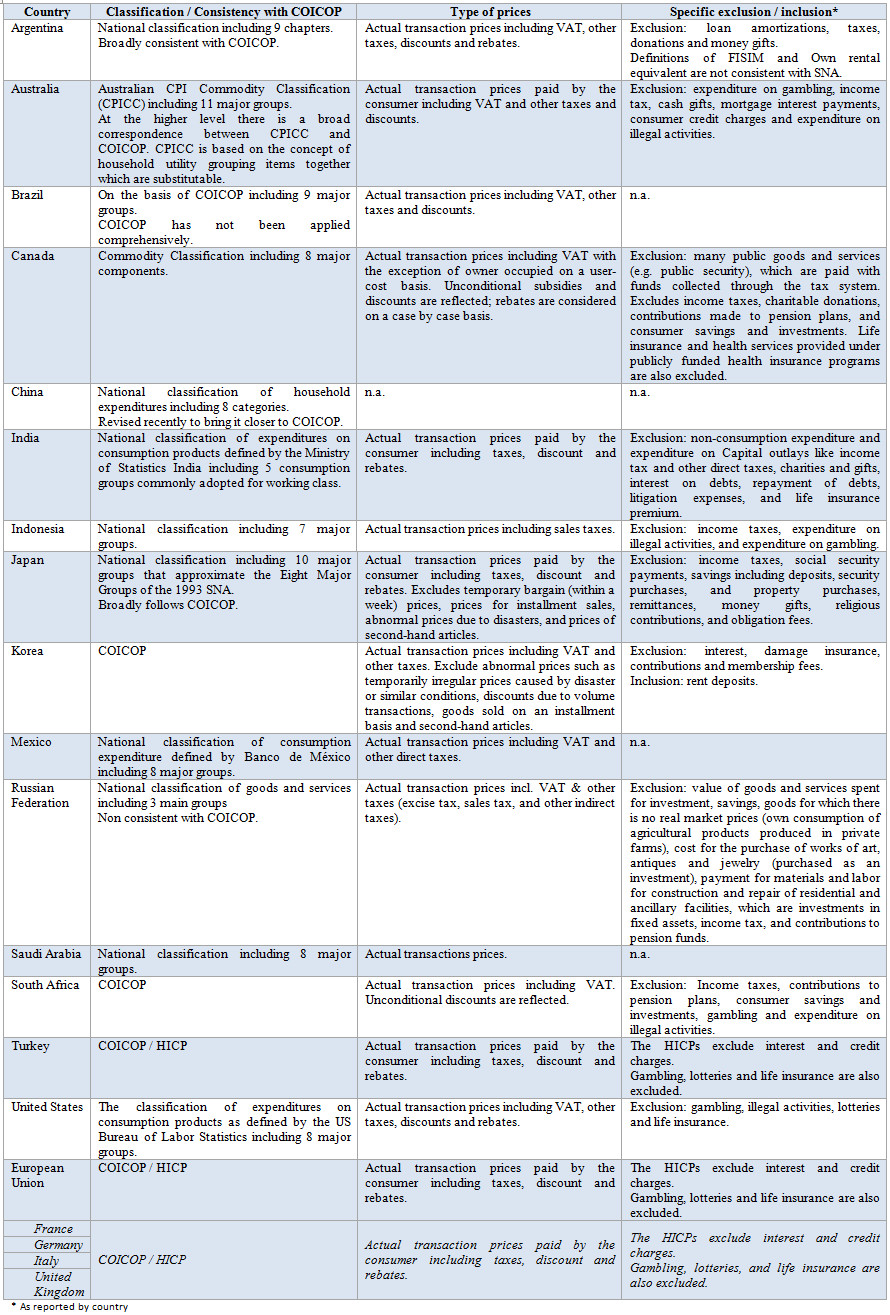
Table 1.Compilation sources.PNG
(
file
)
139 KB
9
12:36, 14 October 2013
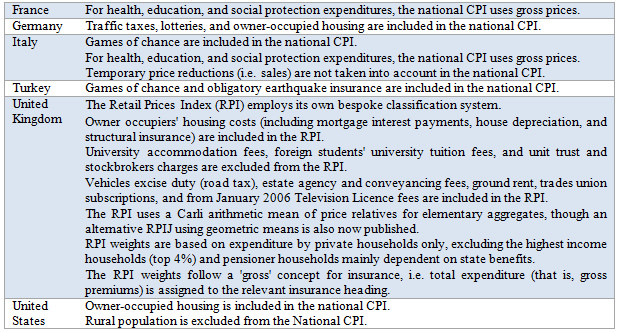
Methodological differences between HICP and national CPI.PNG
(
file
)
172 KB
2
12:38, 14 October 2013
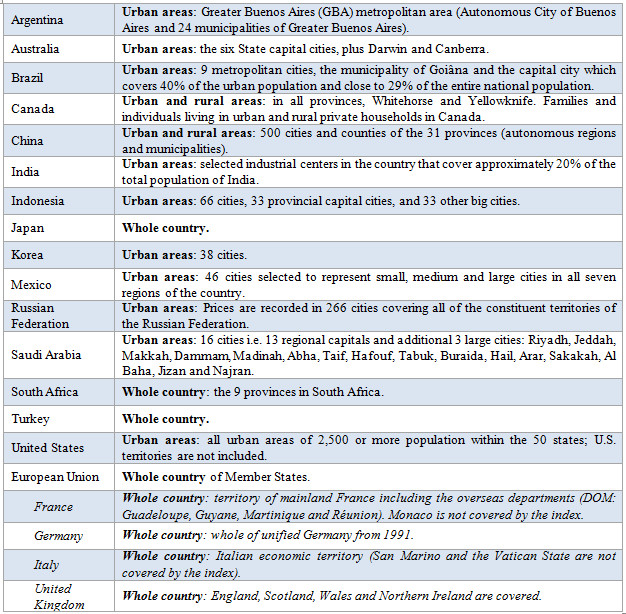
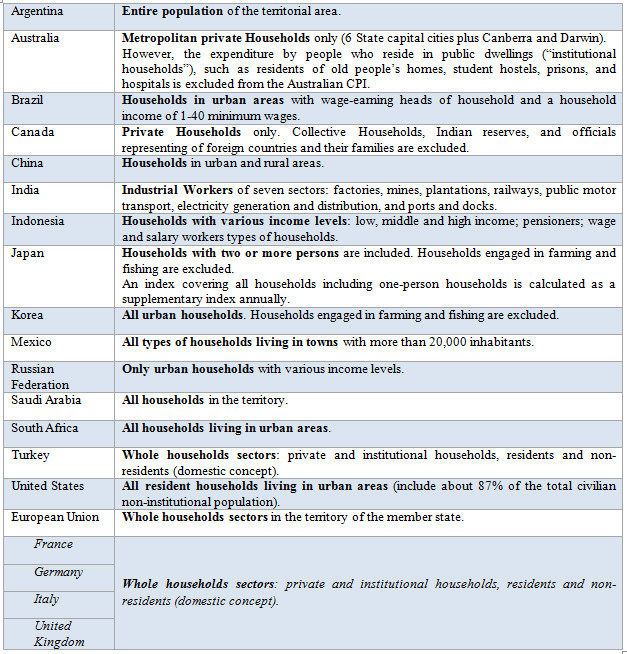
Geographical coverage.PNG
(
file
)
239 KB
2
12:46, 14 October 2013
Items coverage.PNG
(
file
)
632 KB
2
12:50, 14 October 2013
Socio-economic coverage.PNG
(
file
)
240 KB
3
11:25, 7 April 2017
MIP categories new.png
(
file
)
12 KB
1
11:32, 7 April 2017
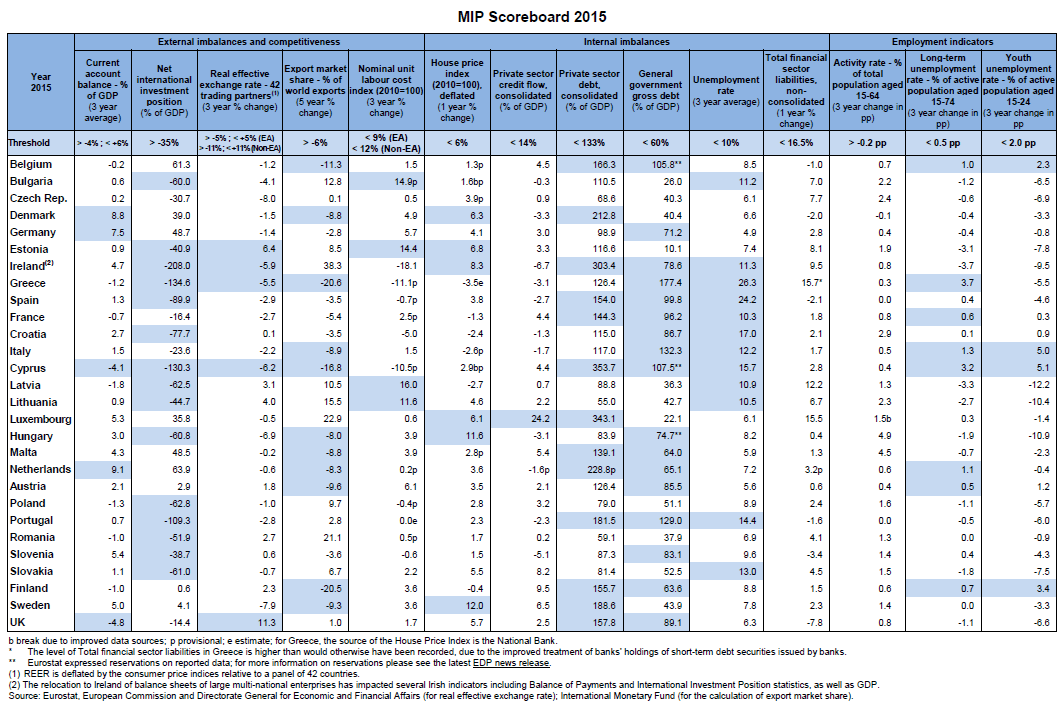
MIP Scoreboard (SA 2017).png
(
file
)
125 KB
1
18:03, 19 November 2018
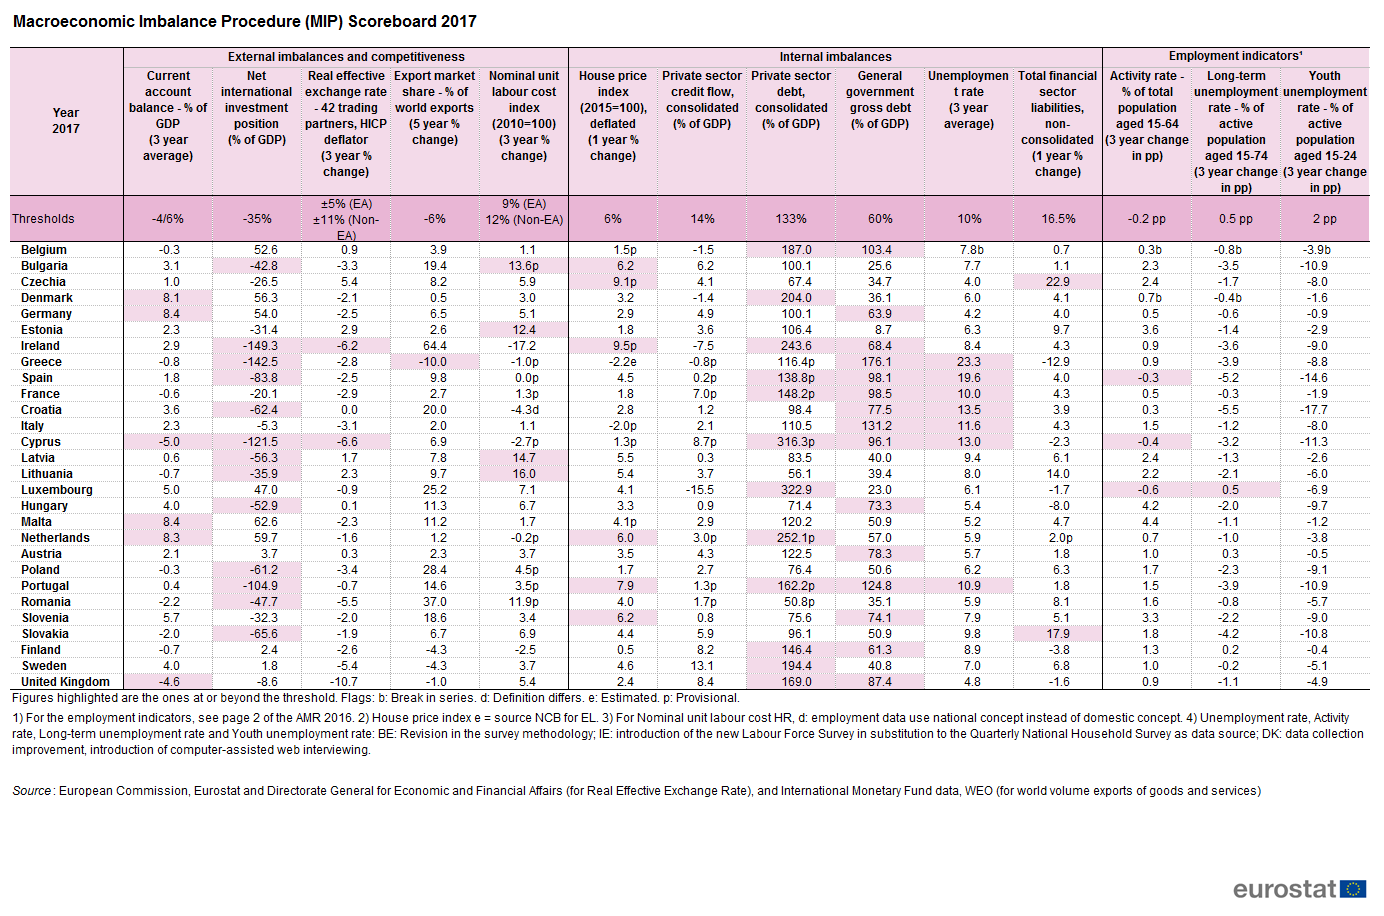
Macroeconomic Imbalance Procedure (MIP) scoreboard 2017 .png
(
file
)
120 KB
1
18:05, 19 November 2018
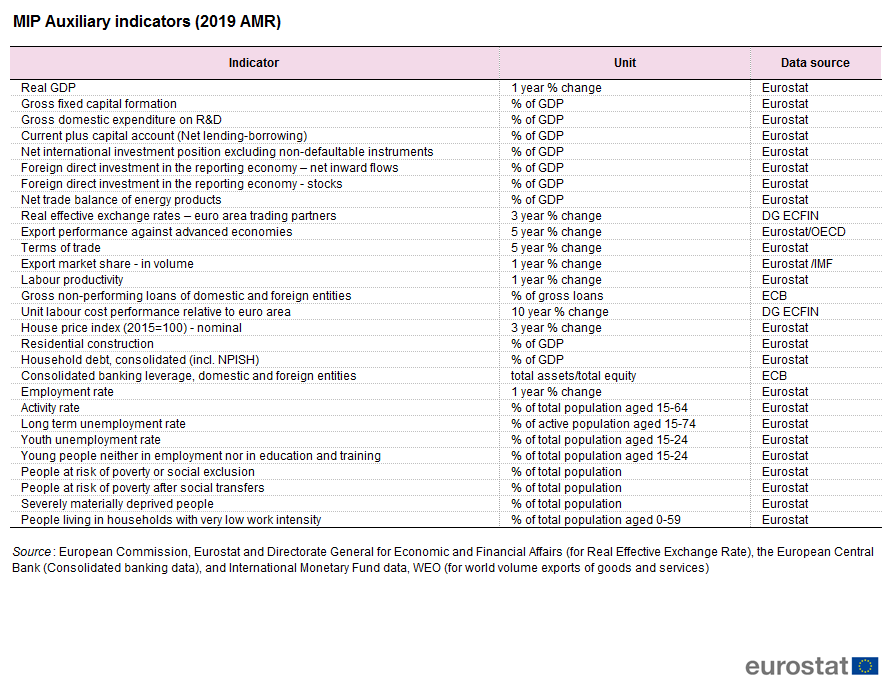
MIP Auxiliary indicators (2019 AMR).png
(
file
)
59 KB
1
18:11, 19 November 2018
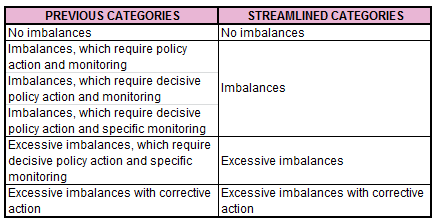
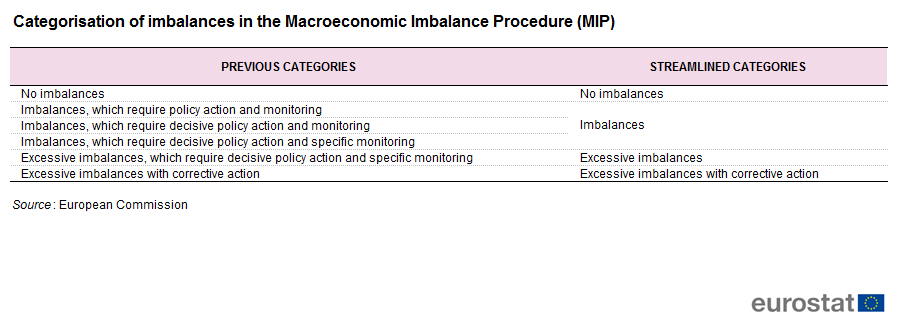
Categorisation of imbalances in the Macroeconomic Imbalance Procedure (MIP).png
(
file
)
18 KB
1
16:05, 20 November 2018
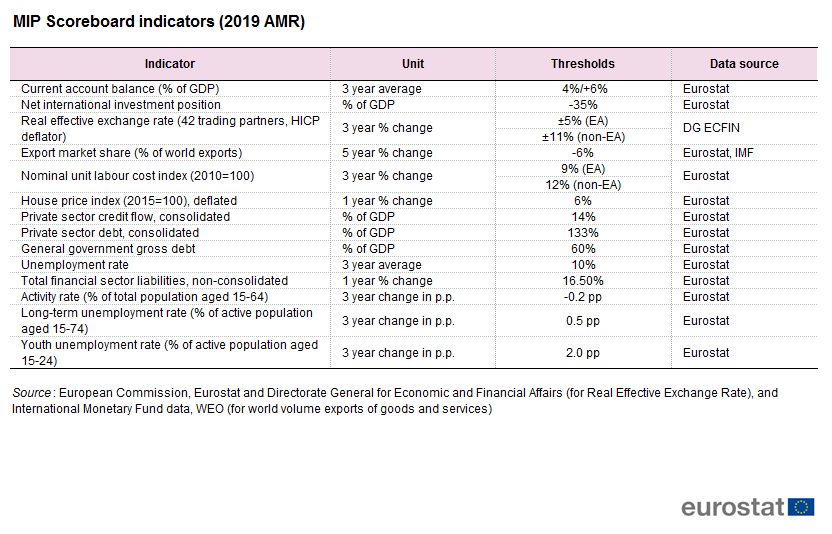
MIP Scoreboard indicators (2019 AMR).png
(
file
)
41 KB
1
Special page
ISSN 2443-8219
.PNG)


.png)
_scoreboard_2017_.png)
.png)
.png)
.png)